


2022 Technical Paper #14
Machinery Room Ventilation and Ammonia Release Computational Fluid Dynamics (CFD) Study
Author:
Scott Davis, PhD, PE;
Derek Engel, PE; and John Pagliaro PhD, PE;
Gexcon US, Inc.
Executive Summary
The ammonia refrigeration industry has a historically good safety record and hence there have been few instances of ammonia release resulting in ignition events. To continue and improve upon safe practice, computational fluid dynamics (CFD) modeling was undertaken in the present study to evaluate the effectiveness of various emergency ventilation designs and emergency ventilation flow rates in protecting against accidental ammonia releases in ammonia refrigeration machinery rooms. The study was specifically limited to only consider ammonia releases from full-bore ¾” diameter line failures containing: 1) high temperature, high pressure liquid (i.e., saturated liquid); 2) low temperature, high pressure liquid (i.e., subcooled liquid); and 3) high pressure vapor (i.e., superheated vapor). The study did not evaluate the rationale behind, nor the likelihood associated with a full-bore ¾” diameter release, hence, as mentioned above, the study was specifically limited to this condition. Note, while larger hole sizes are possible, they do not arise frequently in this industry.
Ammonia as the working fluid in refrigeration cycles exists at various temperatures and pressures throughout the cycle and therefore accidental releases from various ¾” lines throughout the system (e.g., high pressure vapor line or high temperature, high pressure liquid line) can have a range of mass flow rates and the fluid can be in the form of superheated vapor, subcooled liquid, and saturated liquid. To exercise the modeling over a relevant range of inputs, approximately 2,000 CFD simulations in two different sized machinery rooms were performed with various emergency ventilation exhaust rates, emergency ventilation system designs, ammonia leak rates, ammonia release fluid phases, leak locations, inventory sizes, and ambient conditions to comprehensively evaluate the performance of difference ventilation system designs and emergency ventilation flow rates.
The study compared the performance of different emergency ventilation designs and determined the required emergency ventilation rate necessary to mitigate/ minimize flammable cloud formation for each ventilation design and release scenario.
The study considered five different emergency ventilation designs and a range of ventilation flow rates. System performance was evaluated based on the ability of the emergency ventilation design to limit the size of the flammable ammonia/air cloud to less than 25% of the room volume (Vroom≥LFL < 25%) during the release. This threshold criterion was selected to make relative comparisons between ventilation designs and is not intended to be an absolute indicator of risk or safety. Note that some flammable volume above the lower flammability limit (LFL) will always be present when a leak is occurring as the 100% pure ammonia mixes with air resulting in lower concentrations. The criterion of Vroom≥LFL < 25% was chosen based on the slow burning velocity of ammonia and the potentially large venting area through the passive air inlets that will reduce deflagration overpressures.
The results of this study demonstrate that the release characteristics of saturated ammonia liquid, subcooled ammonia liquid and superheated ammonia vapor differ quit substantially. Superheated ammonia vapor releases result in either a buoyant jet of ammonia/air that readily mixes with air in the room, or if the jet impacts an object and loses its momentum, a low-momentum release that tends to rise due to buoyancy. Given superheated ammonia releases are in the gas phase, they result in the lowest overall leak rate amongst the three types studied for ¾” full-bore release and were predicted to be at a maximum of 80 lb/min. Since the entire release is a vapor, the volumetric vapor generation rate is equal to the leak rate.
Maximum leak rates of approximately 900 lb/min were predicted for subcooled liquid ammonia releases. Unlike the superheated vapor releases, the subcooled liquid releases almost entirely remained in the liquid phase. This results in a liquid pool that will spread across the floor, and the primary vapor generation is due to subsequent evaporation from the pool and not from the release. Therefore, the actual volumetric vapor generation rate is controlled by the evaporation of the liquid pool that forms on the ground and is significantly less than the actual leak rate. In addition, the liquid ammonia will evaporate at the vapor-liquid interface and this process will occur at the boiling point temperature of liquid ammonia, which is -28°F (-33°C). Hence given the molecular weight of ammonia, the resulting vapor generated will still be lighter than air and tend to rise towards the ceiling due to buoyancy.
The most challenging releases identified in the present study were the saturated liquid releases, because they resulted in not only the largest vapor generation sources but also because they could exhibit dense gas behavior. For example, when the saturated liquid release occurs directly from the vessel, liquid ammonia exits the orifice/opening and the mass flow rate is accurately approximated using incompressible flow equations and was predicted to be 800-900 lb/min, which if given enough unobstructed distance downstream of the release, can completely flash into vapor (i.e., vapor generation rate = leak rate). These releases also result in ammonia/air mixtures that are more dense than the ambient air that can migrate along the ground in contrast to superheated vapor or subcooled liquid releases.
When there is a certain length of pipe between the reservoir and the release point, the saturated liquid begins to flash in the pipe and thus a two-phase mixture exits the full-bore opening. The mass flow rate of the two-phase mixture is lower than if pure liquid exited. With just 4 inches of ¾” piping, the two-phase flow rate is approximately 300 lb/min as compared to a release from a vessel where the release rate is 800-900 lb/min. Again, if given enough unobstructed distance downstream of the release, the two-phase release can completely flash into vapor (i.e., vapor generation rate = leak rate); however, the resulting release may transition from dense gas to neutrally buoyant. While conditions exist for the saturated liquid releases to impinge on surfaces resulting in partial rainout of the liquid droplets, these releases do not generate as much vapor due the subsequent evaporation of the liquid, and for design purposes, the maximum vapor generation from such releases can be estimated from the leak rate.
The main result from the present study is regardless of the leak type (subcooled liquid, saturated liquid and superheated vapor), leak rate or equivalent vapor generation rate (i.e., for subcooled releases), the emergency ventilation rate needs to be at least 10 times higher than the volumetric leak or vapor generation rate of ammonia for high efficacy designs, and 15 to 20 times higher for passive designs (i.e., designs with no ducting or means to provide directed flow towards the ground) in order to limit the size of the flammable ammonia/air cloud to less than 25% of the room volume (Vroom≥LFL < 25%) during the release.
While the main findings hold true, different ventilation designs performed better for different release types. For the vapor releases, ducted/louvered inlets with high efficacy designs performed the best at ensuring the ammonia was well-mixed in the room and prevented pockets of higher ammonia concentrations from forming. For the subcooled liquid releases resulting in pooling, however, the designs which performed best for vapor releases performed less well. These high-efficacy designs tended to direct make-up airflow towards the ground where liquid pools were present. The increased air flow near the liquid pool increased the evaporation rate which subsequently increased the ammonia vapor generation rate. For cases with liquid pooling, vapor generation rates were lower than the actual leak mass flow rate and were limited by the surface area of the machinery room. The benefits of increased air flow near the floor for the flashing saturated liquid, as the most likely “worst-case” scenario, outweigh the relatively small reduction in performance for subcooled liquid releases due to the increased ammonia evaporation rate.
In contrast, passive ventilation designs (designs with no ducting and a passive make-up air opening(s) on the side of the room) were not as effective in mitigating saturated liquid releases. Conversely, these designs performed better for subcooled liquid releases that formed liquid pools on the ground.
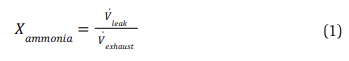
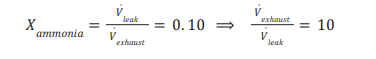
Required emergency ventilation rates for ammonia machinery rooms have conventionally been provided as an equivalent 30 Air Changes per Hour (ACH) of the machinery room. This means that the emergency ventilation rate is linked to the volume of the machinery room, for example 30 volumes of air must be provided per hour within the machinery room, and the emergency ventilation rate is not linked to the actual design release rate of ammonia. However, the resulting concentration of ammonia is related to the volumetric release rate or vapor generation rate of ammonia and the volumetric ventilation rate of the emergency fans. To demonstrate this principal, if an ammonia release is assumed instantaneously well-mixed in a given volume, its steady-state volume fraction (Xammonia) is the ratio of the volumetric release rate or vapor generation rate of ammonia (Vleak) and the volumetric ventilation rate (Vexhaust):
Therefore, if the same ammonia release via a ¾” diameter or other size line occurs in a small volume machinery room, whose volume is five times smaller than say a larger room, the emergency volumetric ventilation rate corresponding to 30 ACH will be five times lower than that for a larger room (i.e., fan flow in cubic feet per hour for 30 ACH in the smaller room CFMsmall = 1 5 CFMlarge). To demonstrate this, releases from the relatively low leak rate of the superheated vapor could easily be mitigated by the traditional 30 ACH emergency ventilation criterion in the large machinery room, however this 30 ACH emergency ventilation requirement was inadequate maintaining flammable ammonia vapor clouds below the threshold criteria of Vroom≥LFL less than 25% in the small machinery room. Hence the present work has determined that the more appropriate measure to recommend or require is the volumetric flow rate of the emergency ventilation system and NOT the equivalent ACH, whereby the necessary volumetric emergency ventilation rate can be readily reported as a certain multiplicative factor larger than the design ammonia volumetric leak or vapor generation rate.
In summary, the required ventilation rate to effectively reduce flammable cloud formation was approximately 10 times larger than the volumetric release rate or vapor generation rate (i.e., from liquid pools) for high-efficacy ducted designs. For passive ventilation designs, the required ventilation rate was 15-20 times larger than the volumetric release rate or vapor generation rate. These results are largely based on the more challenging saturated liquid releases, which were not only determined to be the largest vapor generating release types but also more complicated due to their dense gas behavior. While other release types such as superheated vapor and subcooled liquids can be mitigated to similar flammable levels at lower relative ventilation rates to leak rates (i.e., less than 10 times higher than the volumetric leak or vapor generation rate), this multiplicative factor of 10 will cover the full range of release conditions.
1. Introduction
The International Institute of Ammonia Refrigeration (IIAR) and the Ammonia Refrigeration Foundation (ARF) seek to further understand the effectiveness of various emergency ventilation designs and emergency ventilation rates for controlling the flammability hazard associated with accidental ammonia releases in machinery rooms. This study intends to provide a technical basis for potential updates to the emergency ventilation recommendations and requirements in IIAR-2, Standard for the Safe Design of Closed-Circuit Ammonia Refrigeration Systems.
The present study uses computational fluid dynamics (CFD) to quantitatively evaluate the performance of various emergency ventilation designs and emergency ventilation rates for controlling the flammability hazard during ammonia releases in machinery rooms. The study was limited to two machinery room configurations (small and large) and five ventilation system designs. Furthermore, it was limited to ammonia releases from full-bore failures of ¾” lines containing high temperature, high pressure liquid; low temperature, high pressure liquid; and high pressure vapor; all at specific temperatures and pressures summarized in an upcoming section of this report. The study did not evaluate the rationale behind, nor the likelihood associated with a full-bore ¾” diameter release, hence, as mentioned above, the study was specifically limited to this condition. A wide range of emergency ventilation rates were considered in addition to a range of leak location/direction combinations. In total, approximately 2000 CFD simulations were performed. Emergency ventilation performance was quantitatively evaluated based on the system’s ability to limit the size of the flammable ammonia/air cloud during a leak.
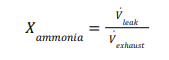
Ammonia is a class B2L flammable refrigerant per ASHRAE 34. It is considered a mildly or marginally flammable substance because its maximum burning velocity in air is less than 10 cm/s. Figure 1.1 below from ref. [1] compares the burning velocity of ammonia to other refrigerants and common hydrocarbons and is provided here to illustrate the lower reactivity of ammonia. Table 1.1 provides a summary of the important ammonia properties when assessing accidental releases and the risk of ignition events.
1.1 Factors affecting the outcome of a release
The resulting dispersion or distribution of ammonia vapor throughout a room during a leak depends on multiple factors, including the vapor density of the fluid, the phase of the release, and the leak momentum.
1.1.1 Vapor releases
In general, refrigeration cycles have high working pressures and therefore refrigerant releases can have high momentum. When there is an un-impinged vapor release into open space, the released fluid rapidly mixes with air due to the high fluid velocity and induced turbulence. This mixing mechanism is often referred to as jet-induced mixing. When a high-pressure, high-momentum vapor release impinges on a solid surface and/or occurs in a confined area, the momentum of the released fluid is significantly reduced hence the amount of jet-induced mixing is reduced, and buoyancy driven flow becomes the primary mechanism for refrigerant migration and mixing with air. Reduced jet-induced mixing can have a significant impact on the resulting concentrations in a room during a leak. For vapor ammonia releases, the ammonia is less dense than air and thus it will tend to migrate upward and accumulate at the ceiling, especially when jet-induced mixing is reduced due to leak impingement.
1.1.2 Liquid releases
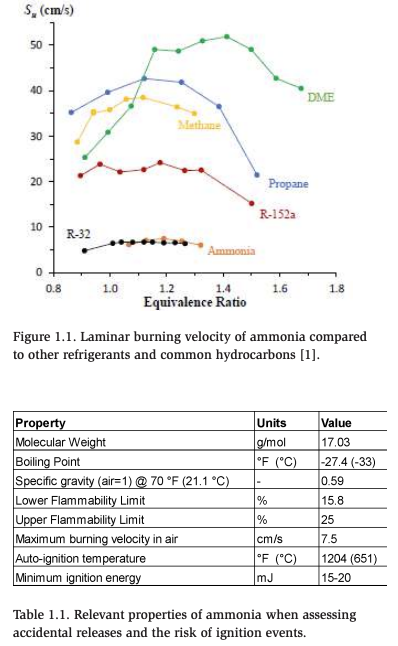
Saturated liquid and two-phase ammonia releases can result in a “flashing” liquid release because the boiling point temperature of ammonia at ambient pressure is much lower than typical temperatures found at locations within the refrigeration cycle and the surrounding environment. During a flashing liquid release, a certain fraction of the released liquid will immediately vaporize (i.e., the initial flash fraction), and if the jet is un-impinged, the remaining droplets may continue to vaporize as air is entrained into the jet as illustrated in the top image of Figure 1.2. The entrained air reduces the partial pressure of ammonia vapor at the surface of the droplets and thus causes the droplets to continue to evaporate and cool below the boiling point temperature at ambient pressure.
For certain liquid releases, there may be some fraction of the liquid that does not vaporize, and which “rains out” of the release and forms a pool in the vicinity of the jet. Furthermore, liquid “rain out” and pool formation can occur if a liquid or two-phase release impinges on a surface as illustrated in the bottom image frame of Figure 1.2.
As will be discussed in more detail later in the report, flashing liquid releases can also result in ammonia/air mixtures that are more dense than the ambient air in a room because of the cold mixture temperatures that occur due to liquid droplets cooling below the boiling point temperature and the entrained air being cooled as a result of the ammonia evaporation (i.e., reduction in entrained air temperature to balance necessary enthalpy of vaporization). Thus, dense gas behavior can occur during flashing liquid releases causing ammonia vapor clouds to form near the floor in contrast to what can occur during a vapor ammonia release.
If the liquid ammonia in the refrigeration cycle is sufficiently subcooled, liquid can exit the release point without flashing and can form a pool on the ground. During these releases, ammonia vapor is generated by the boiling and evaporation of the liquid pool. While the mass flow rate of a subcooled liquid ammonia release can be quite high (i.e., incompressible flow through an orifice), the vapor generation rate can be much lower because is it controlled by the size of the pool, the flow field above the pool, and the heat transfer from the ground to the pool. Furthermore, since the vaporization is supported mainly by heat transfer from the ground, ammonia vapors are released at the boiling point temperature of -28°F (-33°C) and are still buoyant at this temperature. Thus, evaporation from a liquid pool creates buoyant ammonia vapors which will tend to migrate upward.
1.1.3 Ventilation considerations
There are several factors that affect the overall concentration of ammonia in a machinery room during a leak and whether pockets or areas within the room have the potential to contain higher concentrations. Required emergency ventilation rates for ammonia machinery rooms have conventionally been provided as an equivalent 30 Air Changes per Hour (ACH) of the machinery room. This means that the emergency ventilation rate is linked to the volume of the machinery room, for example 30 volumes of air must be provided per hour within the machinery room, and not to the actual design release rate of ammonia. However, the resulting concentration of ammonia is related to the volumetric release or vapor generation rate of ammonia and the volumetric ventilation rate of the emergency fans. To demonstrate this principal, if an ammonia release is assumed instantaneously wellmixed in a given volume, its steady-state volume fraction (Xammonia) is the ratio of the volumetric release rate or vapor generation rate of ammonia (Vleak), given in either cubic meters per hour [m3 /hr] or cubic feet per minute [CFM]) and the volumetric ventilation rate (Vexhaust), given in either cubic meters per hour [m3 /hr ] or cubic feet per minute [CFM]) shown in in Equation 1
Therefore, if the same ammonia release via a ¾” diameter or other size line occurs in a small volume machinery room, whose volume is ten times smaller than say a larger room, the emergency volumetric ventilation rate corresponding to 30 ACH will be ten times lower than that for a larger room (i.e., fan flow in CFM for the smaller room will be CFMsmall = 1 10 CFMlarge). Hence the present work has determined that the more appropriate measure to recommend or require is the volumetric flow rate of the emergency ventilation system and NOT the equivalent ACH.
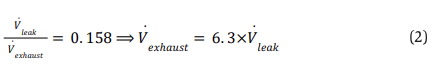
The ideal emergency ventilation system would therefore minimize the likelihood of higher concentration pockets by generating well-mixed conditions throughout the room and would keep ammonia concentrations below threshold levels throughout the room by exhausting the necessary amount of ammonia/air while drawing in fresh air. An emergency ventilation system that keeps the steady-steady volume fraction of ammonia (Xammonia) below the lower flammability limit of 15.8% throughout the entire room would be considered effective as it would prevent the possibility of an ignition event during a leak. Under these ideal conditions, this would occur when the ratio of the ammonia volumetric leak rate or vapor generation rate to volumetric exhaust rate is 0.158 (see Figure 1.3 and Equation 2). Alternatively, under these same conditions the required volumetric emergency ventilation rate can also be reported as being 6.3 times larger than the ammonia volumetric leak or vapor generation rate (see Figure 1.3 and Equation 2).
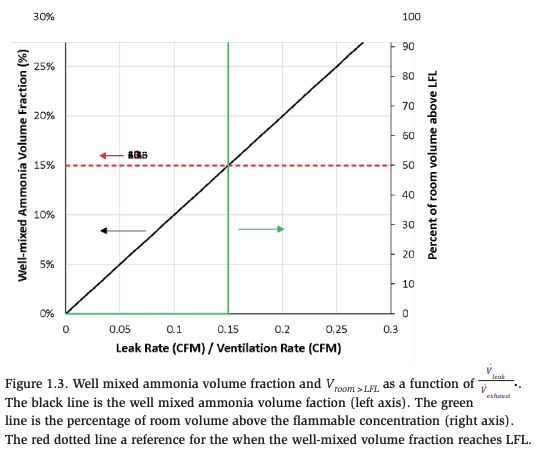
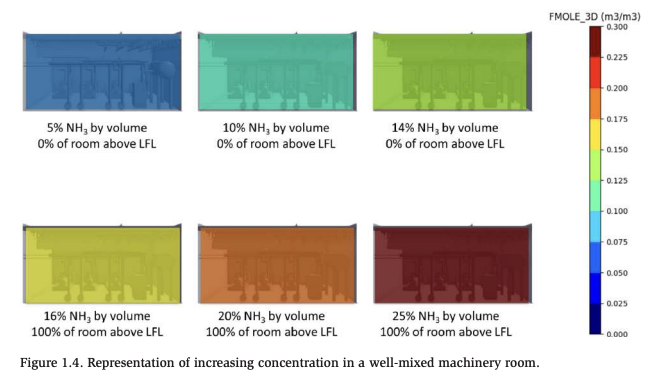
To help further explain the trends shown in Figure 1.3, it is helpful to visualize this concept in a practical geometry. Figure 1.4 shows a perfectly mixed machinery room with increasing ammonia concentration. The ammonia volume fraction is represented by the colormap scale on the right side of the figure. The top left image shows 5% ammonia concentration by volume and subsequent images show ammonia accumulation in the perfectly mixed room. There is no flammable volume (i.e., 0% of room above LFL) when the well mixed concentration is below the LFL (16%). Once the well-mixed concentration exceeds the LFL, then 100% of the perfectly mixed room becomes flammable and greater than the LFL.
In addition, ammonia machinery rooms are densely filled with equipment and piping that contain ammonia, and consequently, leaks can realistically occur throughout the room. Thus, one important characteristic of an effective ventilation design is that the fresh intake air is distributed throughout the entire room so that it can mitigate leaks that occur anywhere in the room and so that it minimizes areas of low ventilation (i.e., dead zones) where higher concentrations of ammonia could accumulate.
There are environmental aspects that influence the mixing and/or spatial variations in ammonia concentrations that occur during a release. These include: (1) the emergency ventilation flow rate; (2) design of the ventilation system (i.e., location of the inlet(s) and outlet(s); (3) the size of the machinery room; and (4) the layout of major obstructions. The volumetric flow rate of the emergency ventilation is critically important in removing ammonia vapor from the room and minimizing pockets containing higher ammonia concentrations. Ventilation designs affect the efficiency of the ventilation system as different ventilation designs are more effective at removing ammonia vapor and minimizing areas of low flow (i.e., dead zones) within the room. Dead zones and recirculation zones are undesirable, especially if it is a location where a leak can occur. Large versus small size rooms can change how much jetinduced mixing is present from a free release. The layout of major obstructions with respect to the ventilation inlet and outlet locations, as well as the release location and direction can change flow patterns and release impingement, all of which effect how ammonia vapor disperses within a room.
Recall for idealized, completely well-mixed environments, the steady state concentration within a room where a leak is occurring is equal to the volumetric leak rate or vapor generation rate of ammonia vapor divided by the volumetric flow rate of the exhaust. This idealized assumption can provide insight into expected concentrations and an estimate of how much ventilation may be required for a specified leak rate. It is clearly evident by this direct relationship that the volumetric flow rate of the emergency ventilation is of paramount importance in mitigating ammonia vapor accumulation.
2. Estimated Leak Rates
This study considered ammonia releases from full-bore ¾” (19 mm) line ruptures containing:
- saturated ammonia liquid at 95°F (35°C)
- saturated ammonia liquid at 95°F (35°C) subcooled to 20°F (-6.6°C)
- saturated ammonia vapor at 95°F (35°C) superheated to 140°F (60°C)
The mass flow rate of the subcooled liquid release was estimated to be 900 lb/min (6.8 kg/s) based on incompressible, all-liquid flow through an orifice. The mass flow rate for the superheated vapor release was estimated to be 80 lb/min (0.6 kg/s) using the appropriate equations for compressible gas flow through an orifice. Note that these are considered maximum flow rates through ¾” orifices, and calculated flow rates are lower when considering the length of pipe between the rupture and fluid reservoir and the corresponding friction losses. Also, the 95°F saturation pressure was selected as most common for systems with evaporative condensing; however, aircooled designs could operate at significantly higher temperature/pressure.
For the saturated liquid release, the mass flow rate is more sensitive to where the line failure occurs. When the release occurs directly from the vessel, liquid ammonia exits the orifice/opening and the mass flow rate is accurately approximated using incompressible flow equations. When there is a certain length of pipe between the reservoir and the release point, the saturated liquid begins to flash in the pipe and thus a two-phase mixture exits the full-bore opening, and the mass flow rate is consequently lower than if pure liquid exited.
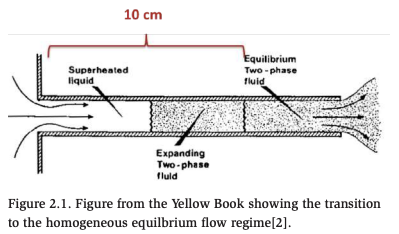
Within approximately the first 4 inches (10 cm) of piping downstream from a reservoir, bubble formation due to flashing occurs and the vapor and liquid phases have yet to become homogeneous (i.e., travel at the same velocity) and reach thermal equilibrium. Beyond approximately 4 inches (10 cm), equal flow velocities and thermal equilibrium are achieved between the two phases, and the flow is considered to have reached the homogeneous equilibrium regime (HEM). This is conceptually illustrated in Figure 2.1. Various methods have been presented in the literature to estimate the mass flow rate of two-phase releases in homogeneous equilibrium (i.e., releases from lines 4 inches (10 cm) or longer) and empirically based correlations are typically applied to estimate mass flow rates from pipes less than 4 inches (10 cm) in length.
To further illustrate the concept, Figure 2.2 shows measured (symbols) and predicted (lines) mass flow rates for saturated water releases from various length to diameter (L/D) pipes and at various supply pressures. Mass flow rates from releases with L/D = 0 are accurately predicted with the incompressible office flow equation (Bernoulli). For L/D ratios greater than 12, the Homogeneous Equilibrium Model (HEM) model accurately predicts the significantly lower mass flow rates.
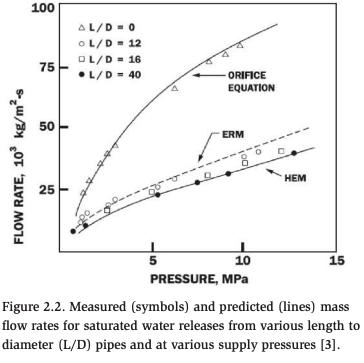
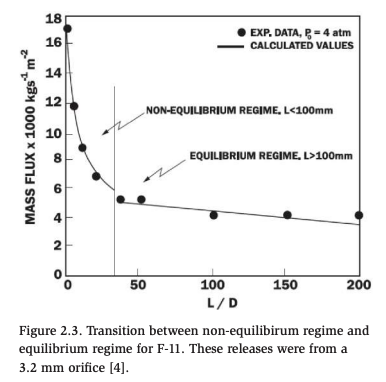
Figure 2.3 provides another illustration of the concept and shows the mass flow rate of freon F-11 from a 3.2 mm orifice as a function of length to diameter ratio (i.e., higher ratio means longer pipe length). As the figure shows, there is a steep decrease in mass flow rate as the pipe increases to 10 cm in length. Below 10 cm, the release occurs in the non-equilibrium flow regime and the mass flow rate in this regime transitions from that of incompressible orifice flow to homogeneous equilibrium flow. For pipe lengths above 10 cm, the mass flow rate changes less with increasing pipe length and this change is due to friction losses.
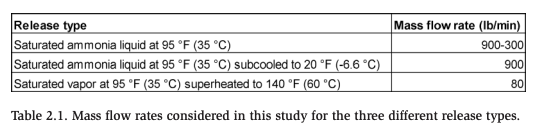
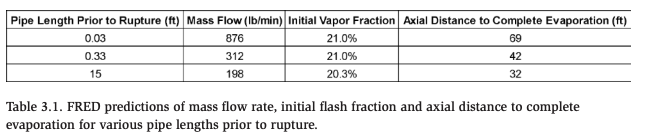
Based on the discussion above, a mass flow rate range was calculated for the saturated liquid releases. The upper bound was calculated assuming incompressible flow through an orifice (i.e., pipe rupture at the reservoir vessel) and the lower bound for the study was calculated assuming a pipe rupture 4 inches (10 cm) downstream of the reservoir where the flow has reached homogeneous equilibrium. Hence, the saturated liquid release mass flow rate was assumed to range between 900 lb/min and 300 lb/min. Table 2.1 summarizes the mass flow rates for the three release types considered in this study.
3. Liquid release, flashing, and rainout
As previously discussed during a flashing liquid release, a certain fraction of the released liquid will immediately vaporize, and the remaining droplets may continue to vaporize as air is entrained into the jet. If the released fluid is cold enough, there may be no flashing and pure liquid may be released from the rupture. The integral tools FRED and PHAST were used to evaluate the conditions resulting from the specified full-bore failures of ¾” lines considered here. FRED and PHAST are commercially available software packages that contain models to evaluate the consequences of releases, including ammonia releases. FRED outputs include plume velocity, plume diameter, plume temperature, plume concentration and amount of liquid in the plume. These conditions effectively characterize the resulting release.
3.1 Subcooled Liquid Releases
The subcooled liquid release was modeled in FRED and showed that nearly all of the release (over 90%) remained in liquid phase. This results in a liquid pool that will spread across the floor and also generate vapor due to subsequent evaporation. The liquid ammonia will evaporate at the vapor-liquid interface and this process will occur at the boiling point temperature of liquid ammonia, which is -28°F (-33°C) for ammonia. Hence, at these temperatures the resulting vapor will still be lighter than air and tend to rise towards the ceiling due to buoyancy.
3.2 Saturated Liquid Release
As mentioned earlier, the “worst-case” release for saturated liquid would be if the ¾” diameter pipe rupture occurred essentially at the source vessel resulting in liquid orifice flow. For the “worst-case” saturated liquid release using the specific pressure/ temperature conditions for this study, FRED did not predict any rainout if the plume was unimpeded for a given distance. The predicted mass flow rates for the ¾” diameter rupture were between 800-900 lb/min, and all the liquid ammonia flashed to vapor at a distance of approximately 70 ft downstream of the leak. If, however, there was a section of ¾” piping that moved the rupture location further from the source vessel, the mass flow rate dropped due to the partial flashing of the liquid in the pipe and the resulting two-phase release via the ¾” pipe segment. Additionally, when these two-phase releases occur, the axial distance to complete evaporation moved closer to the leak source. Hence, if adequate distance was present, all the saturated liquid ammonia releases modeled in FRED for the specified cases studied herein were shown to have complete evaporation some distance downstream of the leak source (i.e., no rainout).
3.2.1 Dense Gas Behavior
FRED predicts both the density of the resulting mixture and can provide side-view concentration contours for the specified releases. For certain cases, especially those where the ¾” rupture occurs at or near the source vessel, the resulting ammoniaair plume behaves as a denser-than-air vapor. To demonstrate this phenomenon for a saturated liquid ¾” full-bore rupture originating from the source vessel, Figure 3.1 shows the dense gas behavior predicted by FRED for the ammonia/air plume downstream of the release, which migrated along the ground away from the release source. This is consistent with PHAST results previously presented in the IIAR Conference Proceeding paper by Timm [5].
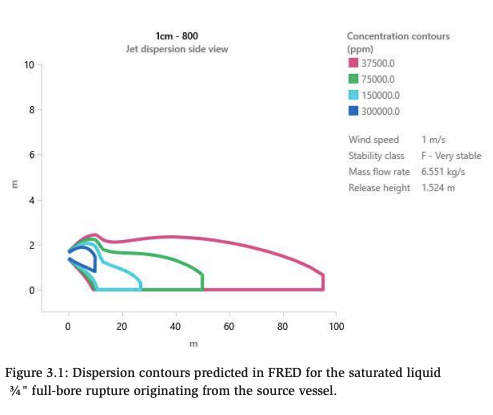
As mentioned earlier, the reason these releases result in ammonia/air mixtures that are more dense than the ambient air in a room is because of the cold mixture temperatures that occur due to liquid droplets cooling below the boiling point temperature and the entrained air being cooled as a result of the ammonia evaporation (i.e., reduction in entrained air temperature to balance necessary enthalpy of vaporization). More specifically, the resulting ammonia/air mixture can reach temperatures of approximately -84°F (-64°C), which will cause the ammonia/ air mixtures to settle near the floor. This is in contrast to the buoyant behavior of vapor ammonia releases, which can reach ammonia/air plume temperatures near 1.4°F (-17°C), and the boiling point of -28°F (-33°C) during pool evaporation.
3.2.2 Neutral Gas Behavior
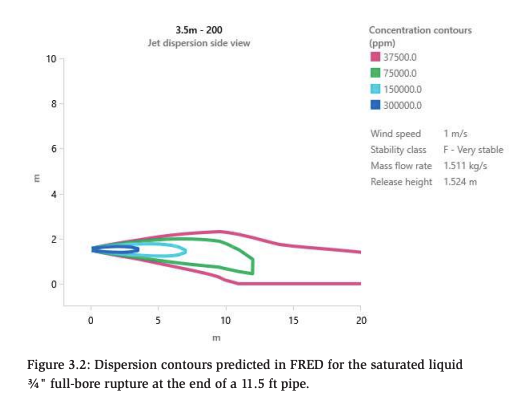
As mentioned above, the mass flow rate of a saturated liquid release drops as the leak location moves further away from the source vessel, which is due to the flashing in the pipe and the pressure losses from the length of pipe itself. The observed dense gas behavior can shift to behave more neutrally buoyant as the mass flow rate decreases with increased pipe length. This is because less energy is required from the surrounding air to convert the remaining liquid mass to vapor, as compared to releases where much of the flashing liquid occurs external to the pipe. Thus, the resulting ammonia/air mixture is warmer and less dense. This phenomenon is demonstrated in Figure 3.2 which shows the near neutrally buoyant concentration contours for a ¾” full-bore rupture 11.5 ft from the vessel predicted with FRED.
4. CFD Modeling
The CFD modeling in this study was done with FLACS. FLACS is a commercially available software developed by Gexcon that can model gas dispersion events and has been extensively validated for this purpose. FLACS can also model both premixed and non-premixed ignition events such as gas explosions and jet/pool fires.
The following sections summarize the machinery room geometries modeled in FLACS, the ventilation designs considered, and other important inputs to the model. Additional simulation details are also provided in Appendix A.
4.1 Geometries
Two geometries were modeled in FLACS to represent a “small” and a “large” machinery room. The project technical committee provided several examples of machine room layouts, including technical drawings, P&ID’s and photographs which provided examples of congestion levels, typical equipment, etc.
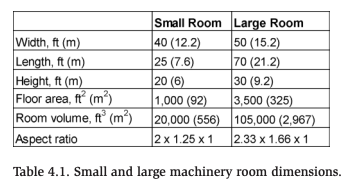
The small machinery room was 40′ wide, 25′ long, and 20′ high (12.2 x 7.6 x 6 m) and the large room was 50′ wide, 70′ long and 30′ high (15.2 x 21.2 x 9.2 m). The net volumes were 20,000 ft3 (556 m3 ) and 105,000 ft3 (2,967 m3 ). The floor areas were 1,000 ft2 (92 m2 ) and 3,500 ft2 (325 m2 ). The aspect ratio for these two rooms was very similar, with the small room having an aspect ratio of 2 wide x 1.25 long x 1 high and the large room having an aspect ratio of 2.33 wide x 1.66 long x 1 high. Table 4.1 summarizes the various dimensions for each room.
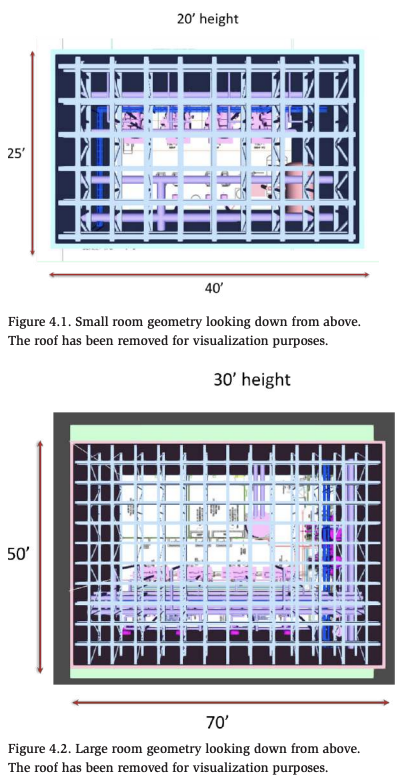
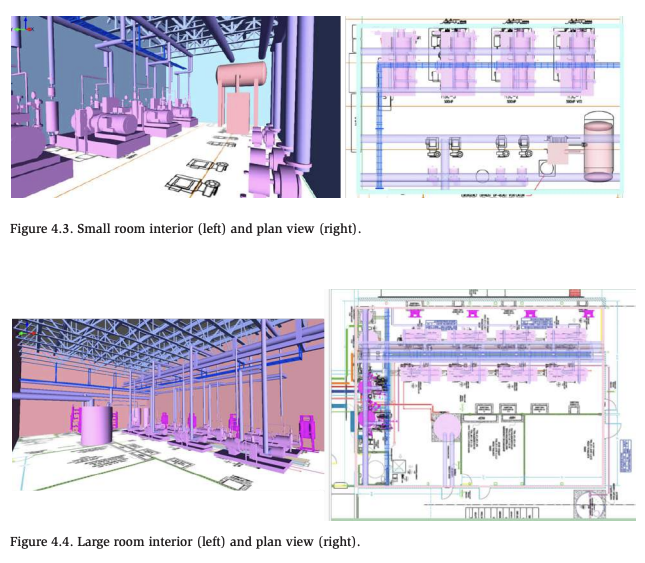
The rooms were populated with objects with input from the project technical committee. There are several compressors and associated piping, pipe racks, cable trays and roof trusses included in the geometries. Figure 4.3 and Figure 4.4 show the equipment included in the small and large rooms.
In order to study the effects of ventilation design, Gexcon created five different geometries for each machinery room (i.e., small and large) to match the descriptions of the ventilation designs requested by the Project Technical Committee. These include the following designs in both the small and large rooms:
- Inlet louver in the wall at floor-level and ceiling exhaust, at opposite end of machinery room.
- Single inlet duct at ceiling and ceiling exhaust, at opposite end of machinery room.
- High-efficacy distribution with ducted supply, directing flow at equipment and two exhaust fans, one at each end of machinery room (only large machinery room).
- Four equally sized passive inlets on the wall adject to the compressors (the wall next to the passive inlet for design #1) with exhaust through the roof.1
- Ventilation system design “1” with additional air circulation provided by a unit cooler providing machinery room air conditioning.
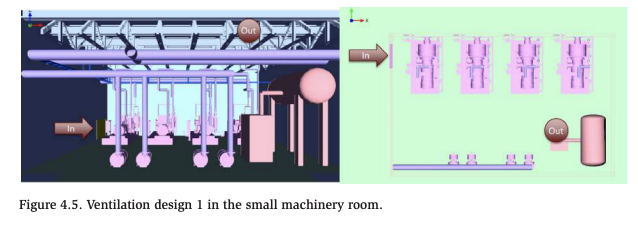
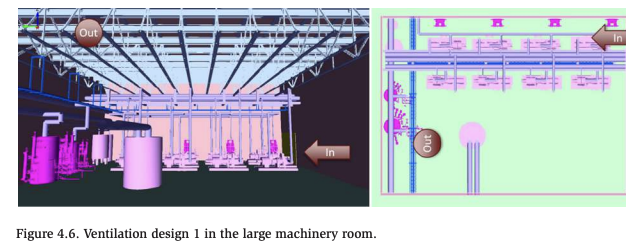
4.1.1 Ventilation Design 1
Ventilation design 1 involves an inlet louver in the wall at floor-level and ceiling exhaust, at the opposite end of the machinery room. The resulting small and large room geometries with ventilation design 1 are provided in Figure 4.5 and Figure 4.6.
1 This was originally provided as “Inlet ducted at ceiling and ducted floor outlets along opposite wall,” however it was changed during preliminary discussions
In this geometry there is an exhaust opening at the ceiling of the structure (near the right side of the images in Figure 4.5). This was modeled as an active fan exhaust in the CFD simulations. The passive inlet in this design is along the side of the room.
4.1.2 Ventilation Design 2
Ventilation design 2 involves a single inlet duct at the ceiling, and a ceiling exhaust duct at the opposite end of the machinery room. The resulting small and large room geometries with ventilation design 2 are provided in Figure 4.7 and Figure 4.8.
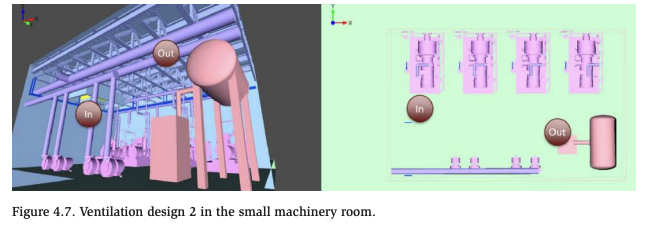
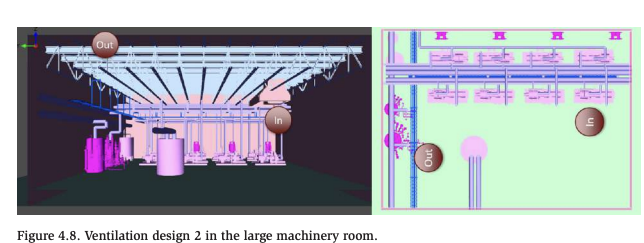
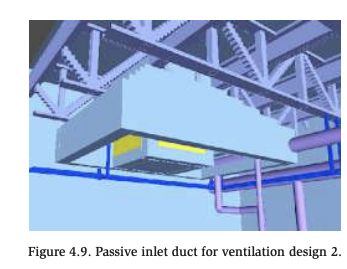
In each geometry there is an exhaust opening at the ceiling of the structure (near the right side of the images in Figure 4.7 and right side of Figure 4.8). The passive inlet in this design is on the ceiling on the other side of the geometry. The inlet is a small, ducted object with obstruction elements to allow for the flow into the room to be directed down at an approximate 45° angle. Off angle leaks are difficult to model on the cartesian grid used in FLACS. Some minor geometry modifications have been made to direct the flow more downwards to ensure flow around the compressors. An image of the passive inlet duct for design 2 is provided in Figure 4.9.
4.1.3 Ventilation Design 3
Ventilation design 3 involves a high-efficacy distribution with a ducted supply directing flow at the compressors, and two exhaust fans, one at each end of the machinery room. Per the original project request, this ventilation design was only implemented in the large room and is shown in Figure 4.10.
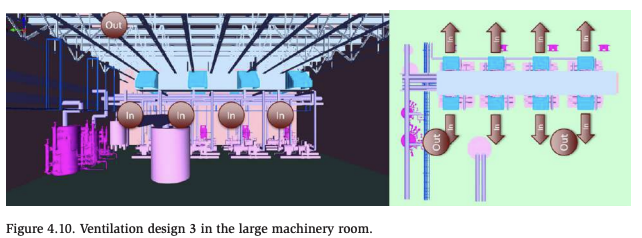
Similar to the ducting in ventilation design 2, the inlet ducts for this design include elements to direct the flow from the ducting downwards to the compressors. This is directed down at an approximate 45° angle.
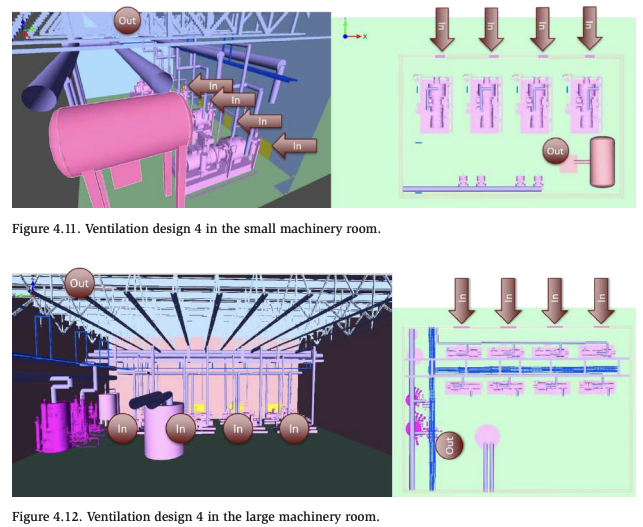
4.1.4 Ventilation Design 4
Ventilation design 4 involves four smaller passive ground level inlets on the wall adjacent to the compressors (the wall next to the passive inlet for ventilation design #1) with exhaust through the roof. The design is shown in Figure 4.11 and Figure 4.12.
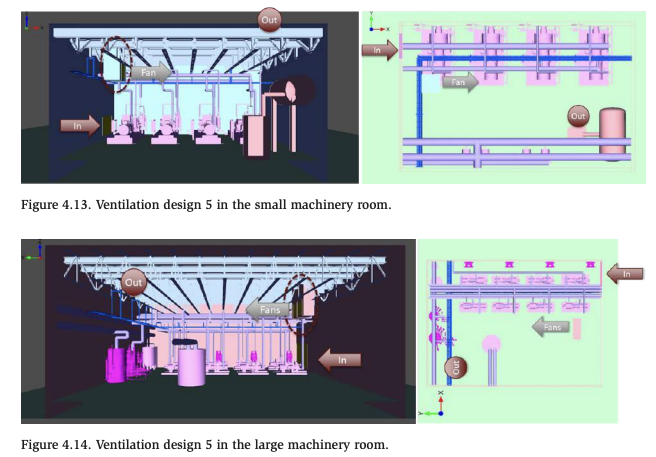
4.1.5 Ventilation Design 5
Ventilation design 5 is similar to ventilation design 1, but with the addition of unit air conditioners providing significant recirculation airflows throughout the room. The small room cooler provided recirculation at a volumetric flow rate of 10,000 CFM from one unit, which means the recirculation rate provided by this unit is the same as the emergency exhaust ventilation at 30 ACH. The large room was equipped with two unit-coolers. They each provide recirculation at a volumetric flow rate of 52,500 CFM for a combined total of 105,000 CFM, which means that the total recirculation rate provided by these two units is the same as the emergency exhaust ventilation at 60 ACH. All other dimensions and openings were the same as those used in ventilation design #1. This ventilation design is shown in Figure 4.13 and Figure 4.14
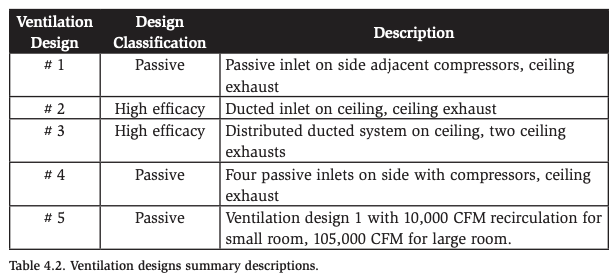
A summary of the ventilation designs is shown in Table 4.2 below.
4.2 Ventilation and System Activation Details
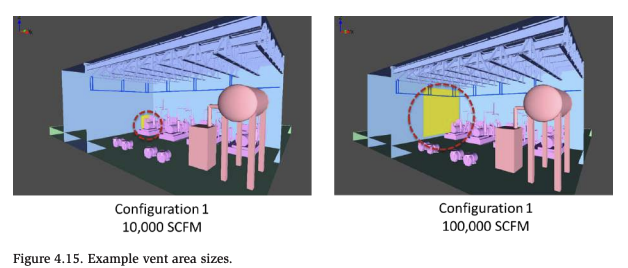
4.2.1 Inlet and Outlet Velocities
In the simulations, the air inlet areas were sized such that the air intake velocity was always approximately 500 ft/min (2.54 m/s) to be consistent with code requirements. Thus, especially for the small room, the air inlet areas varied considerably in size to achieve this constant inlet velocity while evaluating a wide range of emergency ventilation flow rates (i.e., volumetric flow rate is the product of inlet area and flow velocity). Figure 4.15 provides an example of two different passive inlet areas for two simulations in the small room with different emergency ventilation rates.
4.2.2 Ambient Ventilation
Machinery rooms have a required ventilation rate during normal operation of 0.5 cfm per square foot of floor area (2.2×10⁻⁵ m3 /s-m2 ). This was included in the simulations as a small ceiling vent in operation prior to the start of a leak and resulted in a ventilation rate of 500 cfm (0.23 m3/s, 1 ACH) in the small room and 1,750 cfm (0.8 m3/s, 1 ACH) in the large room.
4.2.3 Emergency Ventilation Activation Time
One of the objectives of this study was to trigger the emergency ventilation at some time after the leak started. It was discussed whether triggering should be done upon leak detection via a monitor point in the simulation domain like it would be done in actual applications via a gas detector. Preliminary simulations were therefore performed to understand two things:
- Is there a considerable difference in time to detection for sensors placed at various locations in the room, specifically for the leak rates of interest in the present study?
- Is the resulting flammability hazard sensitive to time to detection and system activation?
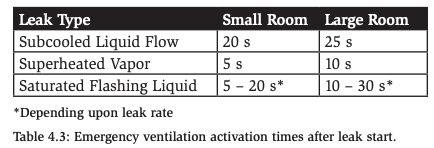
To provide insight, we ran various simulations with four gas detectors in the small and large rooms to see when concentrations at these locations reached 150 ppm (i.e., a typical detector activation threshold). Ammonia leak rates of 80 lb/min (minimum leak rate in this study) and greater were simulated. In the various simulations, 150 ppm concentrations occurred very quickly at all four sensor locations. The most optimal detector placement out of the four considered was on the ceiling near the normally operating ventilation exhaust. Detection at this location typically occurred between 5 seconds and 30 seconds after the leak started. Furthermore, additional screening simulations showed that as long as the detection time was less than 90 seconds, the size of the peak flammable volume in the room remained essentially unchanged. Therefore, it was decided not to activate the emergency ventilation based on ammonia concentrations exceeding 150 ppm at a certain location (i.e., simulating gas detection). Instead, for the remainder of the simulations, we activated the emergency ventilation at specific times after the start of the leak which are summarized in Table 4.3.
Note that the observed insensitivity of activation time to sensor location is likely due to the large leak rates considered in this study. Sensor location may still have a significant relevance for timely response during smaller releases (i.e., lower leak rates), however evaluating this was not part of the present scope.
4.3 Leak details
Leak Locations and Directions
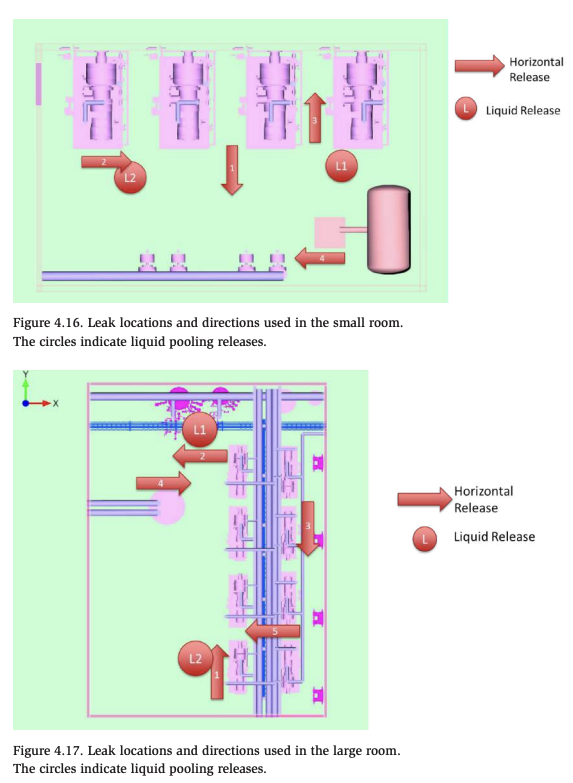
Simulations were performed with several leak locations and leak directions. Leak locations were chosen based on equipment location and locations that were expected to be challenging for the various ventilation designs to mitigate (i.e., based on leak location in relation to inlet and outlet duct locations). All leaks were modeled at a height of 5 feet (1.5 m), with the exception of the subcooled liquid releases, which were modeled closer to the floor given the resulting liquid pool is generally insensitive to release height. In the small room, superheated vapor and saturated liquid releases were simulated at four different locations and subcooled liquid releases were simulated at two different locations. The leak locations and directions in the small room are provided in Figure 4.16. In the large room, superheated vapor and saturated liquid releases were simulated at five different locations and subcooled liquid releases were simulated at two different locations. The leak locations and directions in the large room are provided in Figure 4.17.
Leak Rates
Gexcon used the leak rate estimates presented in Section 2. The mass flow rate of subcooled liquid was 900 lb/min (6.8 kg/s). The superheated vapor release was 80 lb/min (0.6 kg/s). A range of leak rates were used for the saturated liquid releases. The leak rates simulated were 200 lb/min, 300 lb/min and 800 lb/min (1.5, 2.3 and 6.0 kg/s). This range of mass flow rates was modeled because it spans the range of possible leak rates based on the where along a pipe the failure occurs. It therefore enables the study to evaluate the necessary emergency ventilation requirements for worst-case pipe failures (i.e., right at the vessel wall) and pipe failures at other locations in the system downstream from vessels.
4.4 Simulation Matrices
A preliminary round of simulations helped to ultimately guide the scenarios and conditions that were simulated during a second round of modeling. The initial round of simulations helped to identify the range of emergency ventilation rates that may be effective, and thus allowed for a tighter range of ventilation rates to be considered in the second round of simulations.
4.4.1 Subcooled liquid leak scenarios
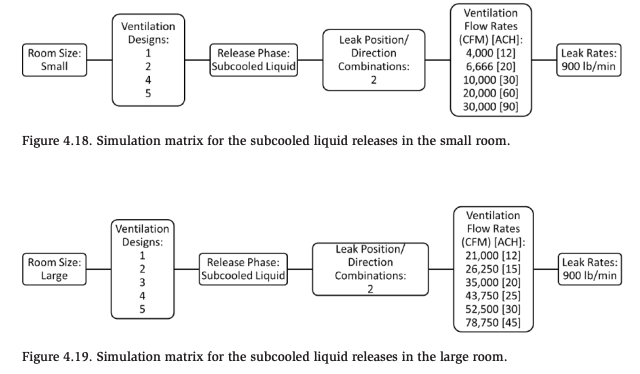
Figure 4.18 and Figure 4.19 provide the simulation matrices for subcooled liquid releases in the small and large machinery rooms. As will be discussed in more detail below, the ventilation rates modeled were low compared those modeled for a similar mass flow rate saturated liquid release, and this was because the preliminary simulations showed that the actual vapor generation rate during a subcooled liquid release is lower than the liquid releases rate from the pipe and controlled by pool evaporation at the floor. Ventilation rates ranged from 4,000 CFM (12 ACH) to 30,000 CFM (90 ACH) in the small room and 21,000 CFM (12 ACH) to 78,750 CFM (45 ACH) in the large room.
4.4.2 Superheated vapor leak scenarios
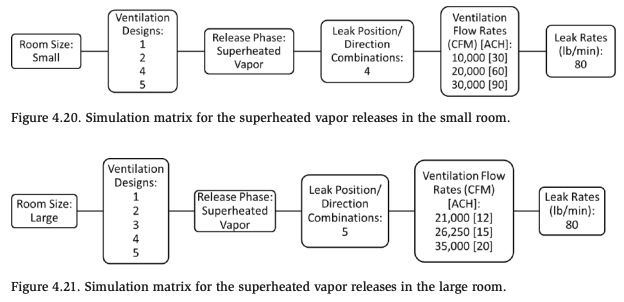
Figure 4.20 and Figure 4.21 provide the simulation matrices for superheated vapor releases in the small and large machinery rooms. Ventilation rates ranged from 10,000 CFM (30 ACH) to 30,000 CFM (90 ACH) in the small room and 21,000 CFM (12 ACH) to 35,000 CFM (20 ACH) in the large room
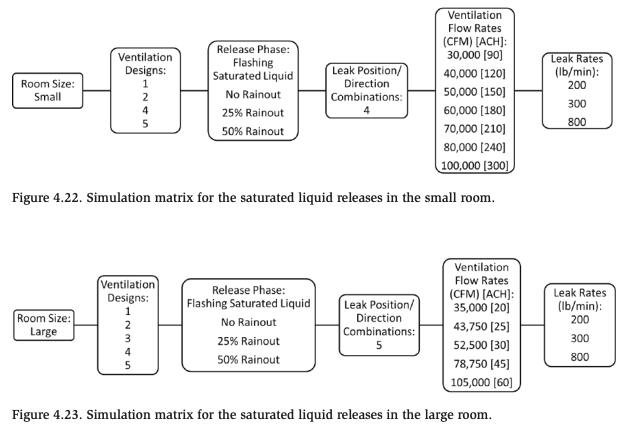
4.4.3 Saturated liquid leak scenarios
Figure 4.22 and Figure 4.23 provide the simulation matrices for saturated liquid releases in the small and large machinery rooms. Calculations showed that a saturated liquid ammonia release from a ¾” diameter line can completely flash to vapor if the release is un-impinged and the room does not significantly cool during the release. Hence, fully flashing releases were modeled with no liquid rainout. The rainout distance (i.e., distance downstream from the leak where all the liquid has evaporated) is on the order of meters, and therefore, if a release is directed towards a wall, the floor, or piece of equipment, liquid rainout could occur. To take this into consideration in the present study, additional simulations were performed with ammonia rainout fractions of 25% and 50% by mass. This was accomplished by simultaneously modeling the flashing fraction of the release and the rainout as forming a liquid pool. More details of the release details can be found in Appendix A.
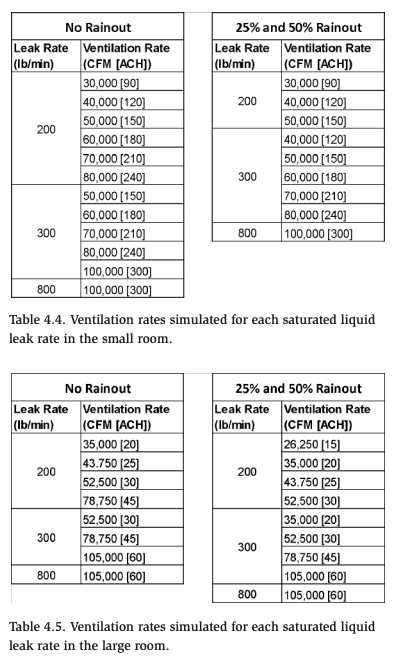
Not all leak rate/ventilation rate combinations were modeled because preliminary simulations and simplified well-mixed calculations indicated that certain ventilation rates would either be unnecessarily high or ineffectively low for a given leak rate. For releases with no rainout, we simulated (leak rate)/(ventilation rate) ratios in the range of 0.05 to 0.15 because they yield concentrations below the LFL under perfectly well-mixed conditions (see Equation 1). For the releases with rainout, we simulated (leak rate)/(ventilation rate) ratios in the range of 0.08 to 0.20 because of the lower ventilation rates needed in the preliminary simulations to control the releases when liquid pooling occurs. Table 4.4 and Table 4.5 show the leak rate/ventilation rate combinations modeled in the small and large machinery rooms.
5. Quantitative Evaluation Approach
Ventilation system performance is quantitatively evaluated using a single metric in the present study: percent of room volume containing ammonia concentrations above the LFL during steady state conditions, Vroom≥LFL. Steady state conditions occur at some point during a leak, and from this point forward, the percent of room volume above LFL remains unchanged as the leak and emergency ventilation continue. In FLACS, the volume within the room above LFL as a function of time can be tracked during a simulation. From this, we extracted the volume within the room above LFL at steady state conditions and then normalized it by the total room volume to determine the percent of room volume containing ammonia concentrations above the LFL during steady state conditions, Vroom≥LFL.
The consequence of a vapor cloud ignition event in a room or other closed space, particularly the resulting overpressure, is directly related to the percent volume of the room filled with flammable concentrations [6]. It is also related to the reactivity of the fuel/air mixture, and for the case of ammonia/air, the reactivity is low (i.e., the 2L refrigerant classification). Thus, in the present study up to approximately 25% room volume above LFL during a leak scenario was assumed to be threshold criterion, and thus a ventilation system that can achieve these levels was also assumed to meet this threshold criterion. This threshold criterion was selected to make relative comparisons between ventilation designs and is not intended to be an absolute indicator of risk or safety. Note that some flammable volume above the lower flammability limit (LFL) will always be present when a leak is occurring as the 100% pure ammonia mixes with air resulting in lower concentrations. The criterion of Vroom≥LFL < 25% was chosen based on the slow burning velocity of ammonia and the potentially large available venting area through the passive air inlets that will reduce deflagration overpressures.
Note that, if necessary, follow up work can be performed to evaluate/support this assumed threshold criterion for ventilation performance. Furthermore, if a different threshold criterion for performance is defined at a later date, the results from this study will likely still show the required ventilation designs and ventilation rates to achieve such performance.
5.1 Reporting Methodology
The results of the present study show a major trend which has influenced the way that we present the data in the following sections. The trend is that the necessary ventilation rate to minimize the consequences of a leak in either sized room (small or large machinery room), and somewhat irrespective of the ventilation design, is directly related to the leak rate. In other words, the higher the leak rate the higher the required volumetric ventilation rate. This also means that the required ventilation in terms of air changes per hour (ACH) will be different for different size rooms as explained next.
5.1.1 Results as related to volumetric ventilation rate
The direct relationship between volumetric leak rate and volumetric exhaust rate implies that the necessary required ventilation rate for a given machinery room should be stated in terms of volumetric flow and not ACH, as it is currently done in IIAR-2. If the same size leak is credible in a small and large machinery room, then the required ACH will be much larger in the small room compared to a large room because the required ventilation rate will be approximately the same in both rooms.
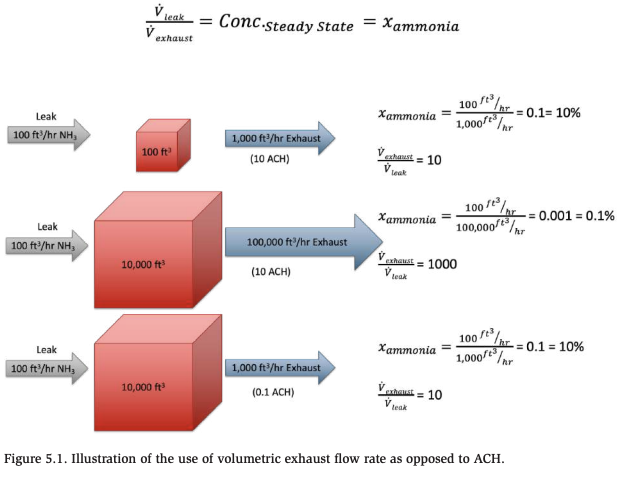
For example, consider two cubical rooms shown in Figure 5.1. Room #1 has a volume of 100 ft3 and Room #2 has a volume of 10,000 ft3 . If the emergency ventilation in each of the rooms was set to 10 ACH, meaning that 10 volumes of each room is changed out every hour, then the resulting ventilation rate in Room #2 is 1666.7 cubic feet per minute (CFM) and 100 times larger than the ventilation flow of 16.7 CFM in Room #1. More specifically:
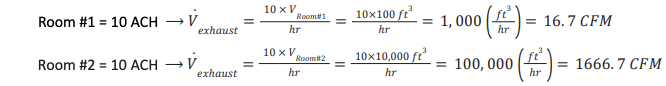
Further, if there is a 100 ft3 /hr leak of ammonia in each of these two rooms, and the rooms are perfectly mixed during the leak, the resulting steady-state well mixed ammonia concentration is 10% in the small room (Room #1) and 0.1% in the large room (Room #2). This is because the steady state concentration is proportional to the volumetric ventilation rate and not to the ACH value, as shown:
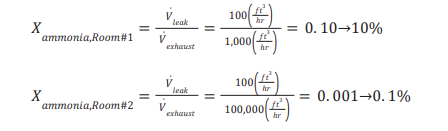
Hence, if the emergency ventilation rate is provided as ACH (i.e., volume of air changes per hour), then the volumetric ventilation rate is governed by the volume of the room. However, if the required emergency exhaust rate is defined as a volumetric rate (1,000 ft3/hr or 16.7 CFM), the resulting concentrations of ammonia by volume for well-mixed conditions are the same in both room sizes, despite there being 10 ACH in the small room and 0.1 ACH in the large room (see Figure 5.1). This is true regardless of the room size when ammonia is well-mixed within the room. Another way of looking at the problem is that in order to maintain well-mixed ammonia concentration at 10% or lower, the emergency ventilation rate must be at least 10 times higher the volumetric leak rate or equivalently:
Thus, requiring a fixed ACH in safety standards or other guidance documents may result in an improper design of the emergency ventilation rate. This is because the necessary emergency ventilation rate is strongly dependent on the volumetric leak rate and almost completely unrelated to room size. Furthermore, once the necessary ventilation volumetric flow rate is determined, the required ACH can easily be calculated based on the size of the machinery room.
In order to demonstrate this principle further, an example of how the data could be plotted as a function of ACH (not volumetric flow rate) is shown in Figure 5.2. The data presented in this example are only from one ventilation design. The first issue addressed is how to present and compare the volume of the room where the ammonia concentration is above the LFL, especially given the larger machinery room is five times larger than the smaller room. The top two images show the results as total room volume containing ammonia concentrations above the LFL during steady state conditions and the bottom two images show the same results; however, plotted as percent of room volume containing ammonia concentrations above the LFL during steady state conditions, Vroom≥LFL. Given the room volumes are not same size, a more direct comparison of ventilation design performance can be made when the data is plotted as percent of room volume containing ammonia concentrations above the LFL or Vroom≥LFL (see Figure 5.2).
More importantly, Figure 5.2 shows that when plotting the results as a function of 12 ACH (bottom image left) or 30 ACH (bottom image right), no clear trend can be observed from the data for a given ventilation design. For example, when considering the 12 ACH as the emergency ventilation rate, volumetric leak rates up to 2,100 ft3 /hr can easily be mitigated in the large room, while volumetric leak rates above 400 ft3 / hr cannot be mitigated in the small room. Similarly, for the 30 ACH results, leak rates up to 6,000 ft3 /hr can be mitigated in the large room, but below 1,000 ft3 /hr in the small room. Hence, Figure 5.2 clearly shows why the volumetric exhaust rate is the more appropriate measure of the emergency ventilation rate.
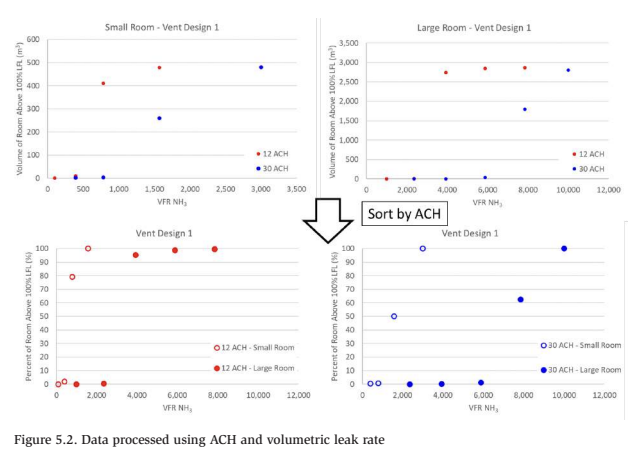
Figure 5.3 shows an alternative presentation of the results as a function of ACH for various leaks in the small room and the large room. Again, the data in this figure are difficult to interpret when plotting the results as a function of ACH. For example, 12 ACH mitigates a 120 lb/min ammonia leak in the large room but does not mitigate a significantly smaller 40 lb/min ammonia leak in the small room. However, if we plot the same data as a function of the volumetric leak-to-ventilation ratio ![]() as shown in the bottom image of Figure 5.3, a clear trend emerges. The trend is that as
as shown in the bottom image of Figure 5.3, a clear trend emerges. The trend is that as![]() decreases below 0.1 or alternatively the volumetric exhaust rate
decreases below 0.1 or alternatively the volumetric exhaust rate ![]() is at least 10 times larger than the volumetric leak rate
is at least 10 times larger than the volumetric leak rate ![]() , the ammonia concentration can be effectively mitigated
, the ammonia concentration can be effectively mitigated ![]()
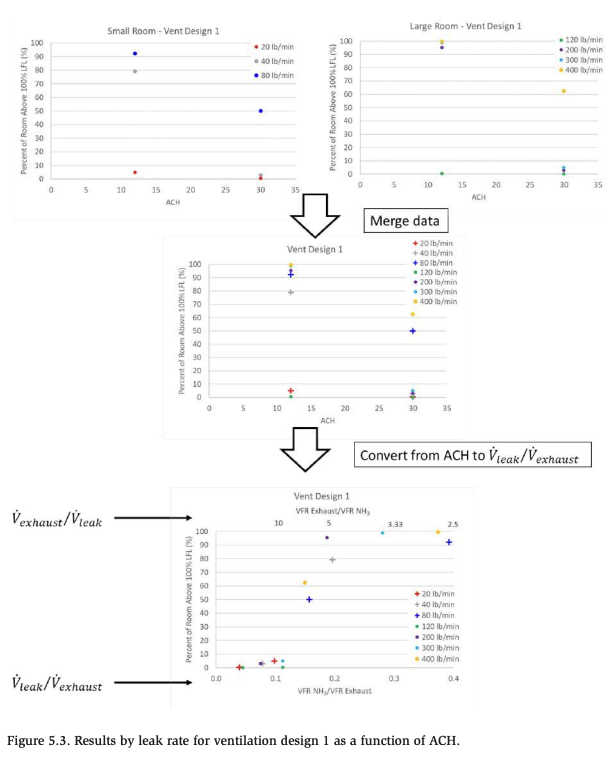
In order to present the results in this manner, the mass flow rate of ammonia is converted to volumetric leak rate based on the leak properties and the ACH is converted to volumetric exhaust rate based on the room volume. We see that leak to-ventilation ratios ![]() of around 0.1 or less result in small volumes above the LFL. Thus, we can compare results and evaluate trends for any leak rate and any room size when plotting the data using this style. Alternatively, for ease of design calculations, the exhaust-to-leak ratio
of around 0.1 or less result in small volumes above the LFL. Thus, we can compare results and evaluate trends for any leak rate and any room size when plotting the data using this style. Alternatively, for ease of design calculations, the exhaust-to-leak ratio ![]() (as opposed to the leak-to-exhaust ratio) is presented as a secondary x-axis along the top of the appropriate figures. This can be thought of as a “multiplication factor” for the required ventilation rate from a specified design leak. Referring back to the bottom image of Figure 5.3, the secondary axis shows that an exhaust rate 10 times higher than the leak rate will produce small volumes above the LFL. This concept will be expanded upon in the following sections.
(as opposed to the leak-to-exhaust ratio) is presented as a secondary x-axis along the top of the appropriate figures. This can be thought of as a “multiplication factor” for the required ventilation rate from a specified design leak. Referring back to the bottom image of Figure 5.3, the secondary axis shows that an exhaust rate 10 times higher than the leak rate will produce small volumes above the LFL. This concept will be expanded upon in the following sections.
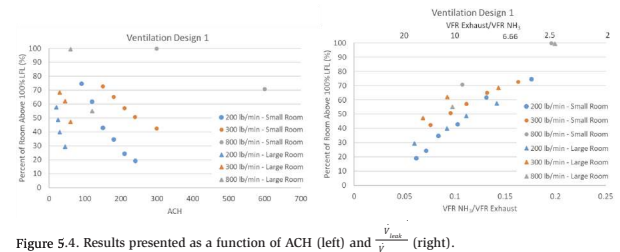
Figure 5.4 shows the results presented both as a function of ACH (left image) and as a function of ![]() (right image). Results as a function of ACH show individual trend lines for each leak rate and each room size. We see that as the ACH increases Vroom≥LFL decreases, however depending on the room volume, the line shifts. For example, a design leak of 200 lb/min and a target Vroom≥LFL of less than 30%, the required ACH is somewhere between 50 and 200 depending upon the volume of the room.
(right image). Results as a function of ACH show individual trend lines for each leak rate and each room size. We see that as the ACH increases Vroom≥LFL decreases, however depending on the room volume, the line shifts. For example, a design leak of 200 lb/min and a target Vroom≥LFL of less than 30%, the required ACH is somewhere between 50 and 200 depending upon the volume of the room.
The right image in Figure 5.4, with Vroom≥LFL presented as a function of ![]() that to achieve a target Vroom≥LFL of less than 30% the required leak rate to exhaust rate ratio is 0.075 (primary x-axis) or alternatively the required volumetric exhaust rate needs to be 13.3 times greater than the considered leak
that to achieve a target Vroom≥LFL of less than 30% the required leak rate to exhaust rate ratio is 0.075 (primary x-axis) or alternatively the required volumetric exhaust rate needs to be 13.3 times greater than the considered leak ![]() Plotted in this fashion, the results are independent of both leak rate and room size.
Plotted in this fashion, the results are independent of both leak rate and room size.
Based on the above discussion, the results in the following sections are presented in figures that show the percent of room volume above LFL (Vroom≥LFL) as a function of leak rate to ventilation rate ratios (i.e., volumetric flow rate of the ammonia leak or vapor generation (liquid pools) divided by the volumetric flow rate of the emergency ventilation). This ratio is referred to hereafter as the leak-to-ventilation ratio or ![]() In addition, the exhaust-to-leak ratio
In addition, the exhaust-to-leak ratio ![]() is also presented on secondary x-axis to show what “multiplication factor” needs to be applied to the required ventilation rate in order to mitigate a design leak below a threshold Vroom≥LFL.
is also presented on secondary x-axis to show what “multiplication factor” needs to be applied to the required ventilation rate in order to mitigate a design leak below a threshold Vroom≥LFL.
This form of presentation allows us to plot together the results for numerous leak rates, and more importantly, clearly shows the significant trend that as the leak rate increases, the necessary ventilation rate increases.
5.1.2 Example results figure
Figure 5.5 provides an example of how the results are presented in the upcoming sections. On the y-axis is the percentage of room volume above LFL (Vroom≥LFL) and on the x-axis is the leak-to-ventilation ratio ![]() ) The vertical red dashed line indicates the leak-to-ventilation ratio at and above which the entire room is filled to concentrations above the LFL under perfectly well-mixed conditions. For lower leak-to-ventilation ratios (i.e., to the left of the line) reduced volumes above LFL are expected due to the non-ideal mixing of actual releases. Data points at a given x-axis location can have different leak rates and ventilations rates, so long as the ratio is the same.
) The vertical red dashed line indicates the leak-to-ventilation ratio at and above which the entire room is filled to concentrations above the LFL under perfectly well-mixed conditions. For lower leak-to-ventilation ratios (i.e., to the left of the line) reduced volumes above LFL are expected due to the non-ideal mixing of actual releases. Data points at a given x-axis location can have different leak rates and ventilations rates, so long as the ratio is the same.
Alternatively, the required volumetric emergency ventilation rate to maintain reduced volumes above the LFL can also be reported as being a certain multiplicative factor larger than the ammonia volumetric leak or vapor generation rate. The secondary x-axis at the top of the figure shows ventilation-to-leak ratio ![]() which is the inverse of the primary x-axis. This ratio can be thought of as the required multiplication factor for the ventilation rate necessary to yield the displayed results for a given leak rate. For example, if a ventilation-to-leak ratio of 10 yields a Vroom≥LFL = 5%, then the ventilation rate was ten times higher than the volumetric leak rate or vapor generation rate for that scenario.
which is the inverse of the primary x-axis. This ratio can be thought of as the required multiplication factor for the ventilation rate necessary to yield the displayed results for a given leak rate. For example, if a ventilation-to-leak ratio of 10 yields a Vroom≥LFL = 5%, then the ventilation rate was ten times higher than the volumetric leak rate or vapor generation rate for that scenario.
The figures below include results for the numerous ventilation designs. Each ventilation design is represented as a different color. Occasionally, the different shape symbols were used to make the data easier to view. The different shapes do not represent different presented variables.
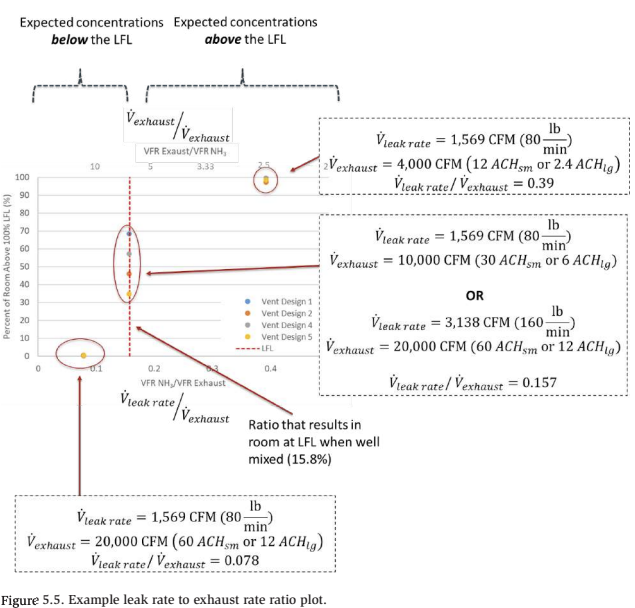
Each data point in the above simplified example corresponds to a simulation, however in cases where there are multiple ![]() ratios with the same ratio value they will appear along they will appear along the same vertical line. For example, the points which occur at
ratios with the same ratio value they will appear along they will appear along the same vertical line. For example, the points which occur at ![]() = 0.157 in the figure could be the result of a 1,569 CFM leak with a 10,000 CFM exhaust rate or a 3,138 CFM leak with 20,000 exhaust rate. These two simulations would, in theory, produce the same steady state concentrations if the room was well mixed.
= 0.157 in the figure could be the result of a 1,569 CFM leak with a 10,000 CFM exhaust rate or a 3,138 CFM leak with 20,000 exhaust rate. These two simulations would, in theory, produce the same steady state concentrations if the room was well mixed.
A chart of this style shows system performance as a function of ![]() ratio. One can calculate the required
ratio. One can calculate the required ![]() for a design leak
for a design leak ![]() to achieve a certain level of performance. Again, referring to the example presented in Figure 5.5, if a machinery room has a design leak of 3,138 CFM and their design target is 0% Vroom≥LFL then the required ventilation rate is 40,000 CFM (12.7 times
to achieve a certain level of performance. Again, referring to the example presented in Figure 5.5, if a machinery room has a design leak of 3,138 CFM and their design target is 0% Vroom≥LFL then the required ventilation rate is 40,000 CFM (12.7 times ![]() ) . This 40,000 CFM would then be used to calculate the equivalent ACH of the room, depending upon its volume. This would be 120 ACH in the small room or 24 ACH in the large room for the two rooms used in this study.
) . This 40,000 CFM would then be used to calculate the equivalent ACH of the room, depending upon its volume. This would be 120 ACH in the small room or 24 ACH in the large room for the two rooms used in this study.
A step-by-step walkthrough of the data processing is shown in Figure 5.6. Unlike the example results shown in Figure 5.2, the data shown in Figure 5.6 use ![]() (volumetric exhaust rate) as opposed to ACH. The first step is to normalize the y-axis to account for the differences in room size. The Vroom≥LFL is plotted as a percentage of the net room volume. The volumetric leak rate
(volumetric exhaust rate) as opposed to ACH. The first step is to normalize the y-axis to account for the differences in room size. The Vroom≥LFL is plotted as a percentage of the net room volume. The volumetric leak rate ![]() ) is then divided by the volumetric exhaust rate
) is then divided by the volumetric exhaust rate ![]() . Once the
. Once the ![]() is calculated for each data point, there is no longer a need to separate by ACH. The data can then be merged to show system performance for each ventilation design.
is calculated for each data point, there is no longer a need to separate by ACH. The data can then be merged to show system performance for each ventilation design.
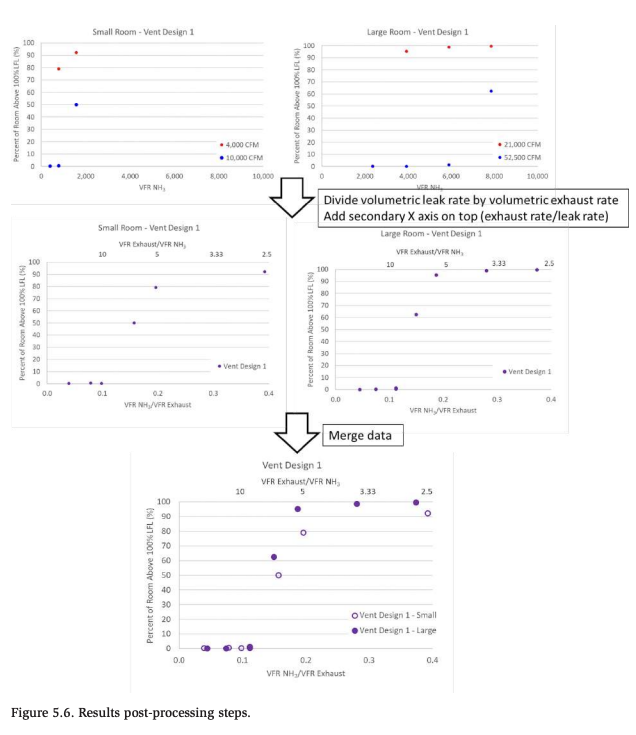
In some cases, especially those which produce very small Vroom≥LFL, many of the data points overlap one another. In the previous figure, there are four data points located under the left most point. This will occur in other plots going forward and should not be considered as missing data points.
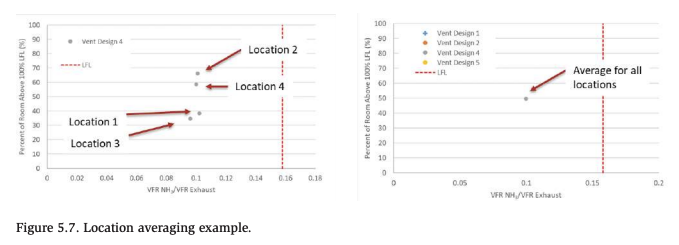
5.1.3 Averaging results for different leak location/position combinations
Leaks can occur practically at any location where there is ammonia containing equipment or piping and leaks can be directed in any direction, both of which can influence Vroom≥LFL during a leak. Thus, the performance of a certain ventilation system is evaluated based on the average performance for the various leak location/ direction combinations modeled. For example, if a leak is modeled at four locations and all other variables are held constant, Vroom≥LFL in those four simulations can be averaged to show the average performance. This type of averaging is referred to in the remainder of the report at the leak-position-averaged results. An example of this averaging is shown in Figure 5.7. This makes the presentation of results clearer because it significantly reduces the number of points on each figure.
6. Results and Discussion
6.1 Introduction
Results are first presented based on leak type: superheated vapor, subcooled liquid and saturated liquid. Results for the various leak types are then compared. Additionally, sensitivities were performed to evaluate the effect of: 1) a colder ambient temperature on the overall results; 2) limiting the available ammonia inventory during a leak; and 3) changing the aspect ratio of the passive air inlet in Ventilation Design 1. These results are summarized in Appendix B.
6.2 Superheated Vapor Releases
Figure 6.1 presents the leak-position-averaged results for the superheated vapor releases in the small room. The results for each individual leak location/position are included in Appendix C. The calculated release rate for this release was low (80 lb/ min) compared to the subcooled liquid and saturated liquid releases (~800 lb/min). Because of the lower leak rate for the superheated vapor releases, lower ventilation rates are required to maintain Vroom≥LFL at or below the threshold level.
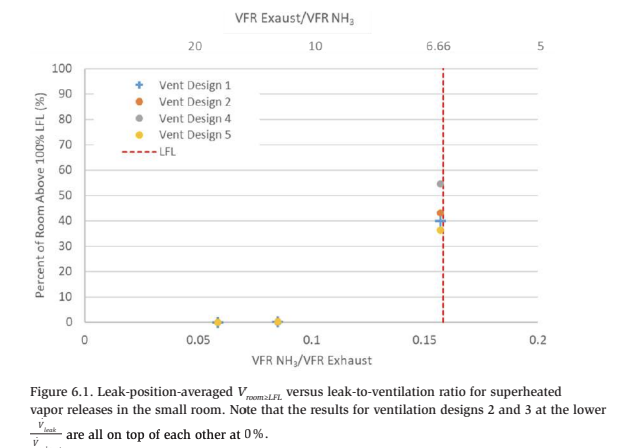
Figure 6.1 shows that all four ventilation designs performed well for ![]() less than 0.1. Ventilation rates of 20,000 CFM (60 ACH) and 30,000 CFM (90 ACH) were shown to keep Vroom≥LFL below 1%, however a ventilation rate of 10,000 CFM (30 ACH) exceeded the threshold criteria of Vroom≥LFL less than 25%. Ammonia vapor released into a room during a superheated vapor release is less dense than air and therefore buoyantly rises toward the ceiling where the emergency ventilation exhaust ducts are located.
less than 0.1. Ventilation rates of 20,000 CFM (60 ACH) and 30,000 CFM (90 ACH) were shown to keep Vroom≥LFL below 1%, however a ventilation rate of 10,000 CFM (30 ACH) exceeded the threshold criteria of Vroom≥LFL less than 25%. Ammonia vapor released into a room during a superheated vapor release is less dense than air and therefore buoyantly rises toward the ceiling where the emergency ventilation exhaust ducts are located.
Given the original goal of the study was to evaluate the maximum release via a ¾” full-bore, the leak rate was limited to 80 lb/min and typical ventilation rates of 10,000 to 30,000 CFM (30 ACH to 90 ACH) were only evaluated. While this shows that superheated releases via a ¾” full-bore cannot be controlled using the traditional emergency ventilation rate of 30 ACH, it also does not provide detailed information on minimum threshold exhaust rate requirements for these lighter-than-air releases. Hence, in order to provide more thorough recommendations on the minimum emergency exhaust rates to mitigate superheated releases, Gexcon decided to run additional ![]() combinations for mass flow rates ranging from 80 lb/min to 400 lb/ min with ventilation rates up to 60,000 CFM (180 ACH).
combinations for mass flow rates ranging from 80 lb/min to 400 lb/ min with ventilation rates up to 60,000 CFM (180 ACH).
Figure 6.2 shows the results from these additional simulations and helps establish the minimum threshold exhaust rate for releases which exhibit buoyant gas behavior. More specifically, the results show that in order to keep Vroom≥LFL below 25% ![]() must be around 0.1. This means that needs
must be around 0.1. This means that needs ![]() ). to be at least 10 times greater than vapor generation rate for the superheated vapor release in the small room.
). to be at least 10 times greater than vapor generation rate for the superheated vapor release in the small room.
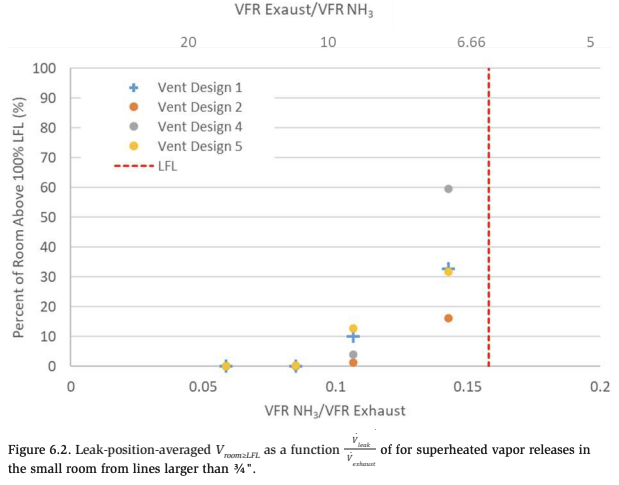
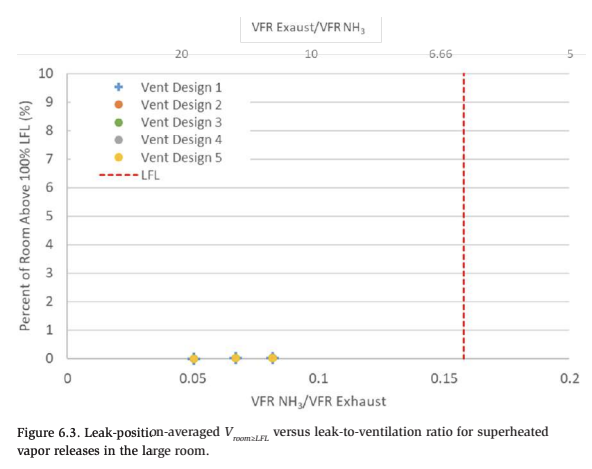
Figure 6.3 provides the results for superheated vapor releases in the large room for the 80 lb/min release from the ¾” line. The ventilation designs performed equally well in the large room as compared to the small room. Leak-to-ventilation ratios ![]() ) of 0.1 or less were effective at keeping Vroom≥LFL below 1%. Ventilation rates of 21,000 CFM (12 ACH), 26,250 CFM (15 ACH) and 35,000 CFM (20 ACH) also kept Vroom≥LFL below 1%.
) of 0.1 or less were effective at keeping Vroom≥LFL below 1%. Ventilation rates of 21,000 CFM (12 ACH), 26,250 CFM (15 ACH) and 35,000 CFM (20 ACH) also kept Vroom≥LFL below 1%.
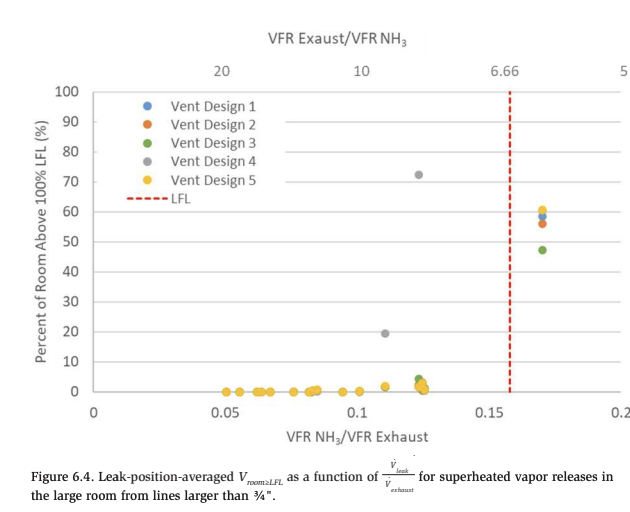
Similar to the small room, the ventilation rates considered for the 80 lb/min release rate do not adequately establish the minimum threshold exhaust rates for ![]() greater than 0.075. Hence, Figure 6.6 includes additional
greater than 0.075. Hence, Figure 6.6 includes additional ![]() combinations up to 800 lb/min with 105,000 CFM (60 ACH) of ventilation to provide more thorough recommendations on the minimum emergency exhaust rates to mitigate superheated releases. These results show that in order to keep Vroom≥LFL below 25%,
combinations up to 800 lb/min with 105,000 CFM (60 ACH) of ventilation to provide more thorough recommendations on the minimum emergency exhaust rates to mitigate superheated releases. These results show that in order to keep Vroom≥LFL below 25%, ![]() must be 0.11 or less. This means that
must be 0.11 or less. This means that ![]() needs to be at least 9 times greater than vapor generation rate for the superheated vapor release in the large room.
needs to be at least 9 times greater than vapor generation rate for the superheated vapor release in the large room.
6.3 Subcooled Liquid Releases
The subcooled liquid releases result in an evaporating liquid pool on the ground. Vapor evaporating from the pool is released near the boiling point temperature (-33°C) and is less dense than the ambient air and therefore buoyantly rises toward the ceiling. When ![]() is calculated based on the equivalent vapor volumetric flow rate of the liquid release the results show that ventilation rates on the order of the leak rate (i.e.,
is calculated based on the equivalent vapor volumetric flow rate of the liquid release the results show that ventilation rates on the order of the leak rate (i.e.,![]() of ~1-2) can keep Vroom≥LFL to a minimum (see Figure 6.5).
of ~1-2) can keep Vroom≥LFL to a minimum (see Figure 6.5).
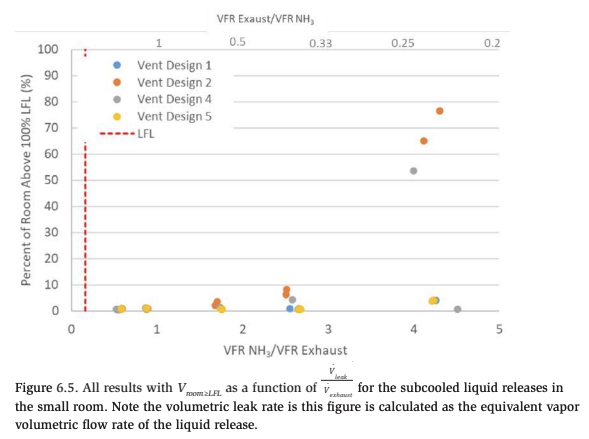
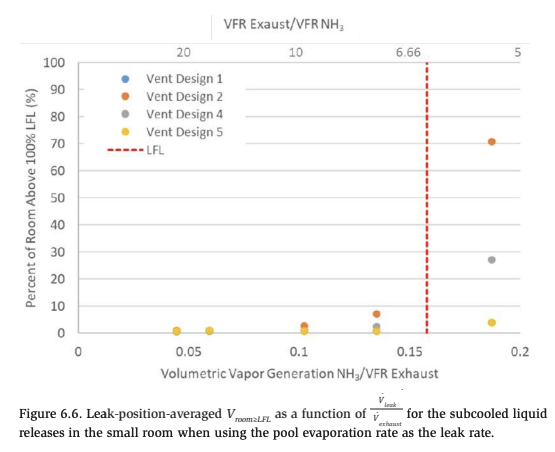
This is somewhat misleading however because the rate of vapor generation from the liquid the liquid pools during these releases is far less than the liquid leak rate from the fractured ¾” line. In other words, the pools gradually grow and accumulate in mass because the evaporation rate is lower than the leak rate of 900 lb/min. Thus, the actual rate of ammonia vapor generation, which the ventilation system needs to handle, is less than the leak rate. Figure 6.6 and Figure 6.7 present the results when using ratios calculated using the pool evaporation rate as the leak rate. These results indicate a low Vroom≥LFL for less than 0.158, which is consistent with the results for the superheated vapor releases. Alternatively, this means that needs to be at least 6.3 times greater than vapor generation rate for the liquid pools.
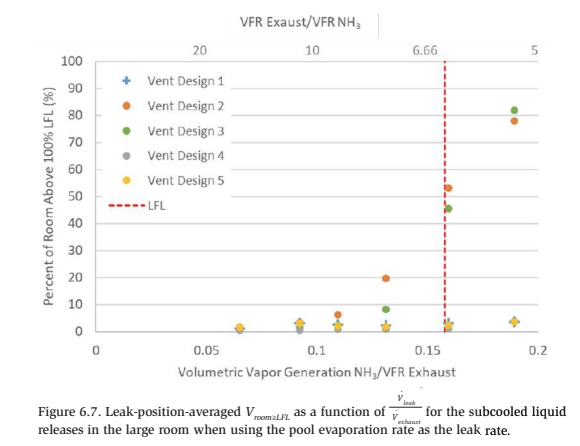
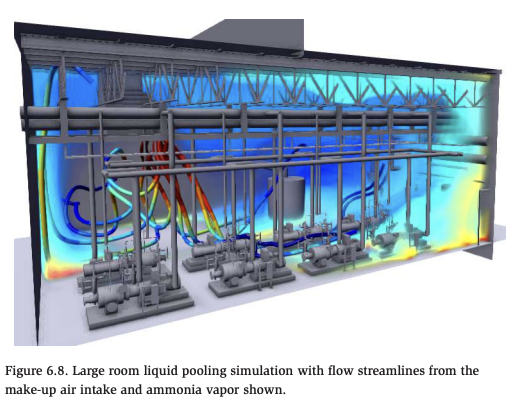
Ventilation designs 2 and 3 (3 in the large room only) yielded larger Vroom≥LFL for similar ![]() values compared to the other ventilation designs. Recall that these two ventilation designs include flow diverters, and the make-up air is directed downward towards the floor. This downward airflow increases the evaporation rate and resulted in a higher pool evaporation rate (i.e., vapor generation rates). Figure 6.8 shows streamlines originating from the make-up air inlet at the ceiling when modeling ventilation design 2 in the large room. The flow path is directed down towards the floor and the liquid pool (pool not visible in the figure).
values compared to the other ventilation designs. Recall that these two ventilation designs include flow diverters, and the make-up air is directed downward towards the floor. This downward airflow increases the evaporation rate and resulted in a higher pool evaporation rate (i.e., vapor generation rates). Figure 6.8 shows streamlines originating from the make-up air inlet at the ceiling when modeling ventilation design 2 in the large room. The flow path is directed down towards the floor and the liquid pool (pool not visible in the figure).
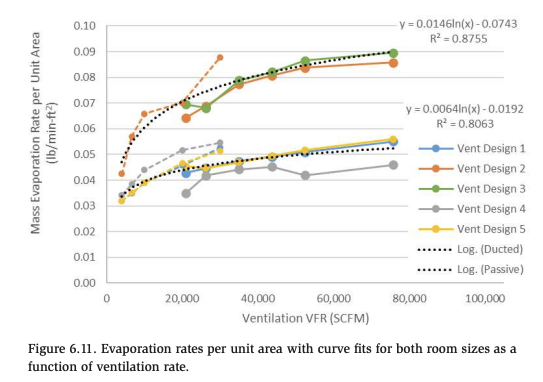
6.3.1 Pool Evaporation Rates
The results from the previous section show that the amount of ammonia vapor that the ventilation system needs to handle during the subcooled liquid releases modeled in this study is dependent upon the evaporation rate of the ammonia pool on the floor. Note that for the leak rates considered in this study, the liquid pool covers the entire floor at some point after leak start. Evaporation rates per unit area for both the small room and large room are plotted in Figure 6.9 and Figure 6.10 as a function of ventilation rate. As the ventilation rate increases, flow velocities near the floor increase which leads to an increased evaporation rate.
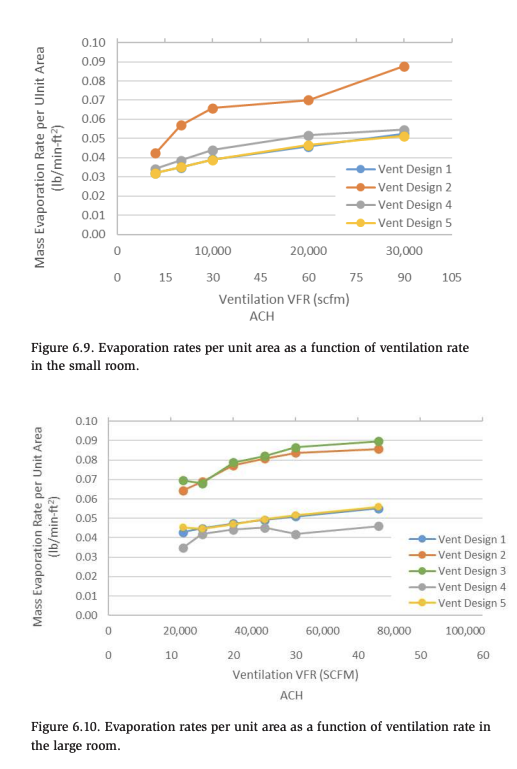
Figure 6.11 shows the small room (dashed lines) and large room (solid lines) results together and fitted with black dotted lines (one for each ventilation style grouping). Designs 2 and 3, with their downward directed inlet airflow result in increased evaporation rates. Designs 1, 4 and 5 have passive inlets positioned horizontally in the room and airflow generally comes in through the side and exits through the ceiling exhaust resulting in lower flow velocities near the floor and thus lower evaporation rates. As discussed later in the report, these correlations are useful for estimating the liquid pool evaporation rate in a given room when there is a subcooled liquid release, and hence the required emergency ventilation rate needed to control the vapor generation consequences of the liquid pooling leak.
6.4 Saturated Liquid Releases
This section presents the results for the saturated liquid releases. Numerous leak rates and ventilation rates were considered, and thus this particular set of simulations composed the bulk of the simulations performed as part of the study.
6.4.1 No rainout
Figure 6.12 shows the leak-position-averaged results for the saturated liquid releases with no rainout in the small room (individual leak position/direction results can be found in Appendix C). ![]() values of 0.1 result in Vroom≥LFL values between 30% and 50%. Depending on the release location and direction,
values of 0.1 result in Vroom≥LFL values between 30% and 50%. Depending on the release location and direction, ![]() = 0.1 can also produce very small volumes above the LFL. High-efficacy ducted ventilation design 2 produced a Vroom≥LFL less than 20% for
= 0.1 can also produce very small volumes above the LFL. High-efficacy ducted ventilation design 2 produced a Vroom≥LFL less than 20% for ![]() less than 0.1, which means
less than 0.1, which means ![]() needs to be at least 10 times greater than volumetric leak rate. The other passive inlet cases performed poorly for the dense ammonia plumes and resulted in large Vroom≥LFL values. These passive inlet designs require a
needs to be at least 10 times greater than volumetric leak rate. The other passive inlet cases performed poorly for the dense ammonia plumes and resulted in large Vroom≥LFL values. These passive inlet designs require a ![]() closer to 0.075 or lower to effectively reduce flammable ammonia volumes, or equivalently
closer to 0.075 or lower to effectively reduce flammable ammonia volumes, or equivalently ![]() needs to be at least 13 times greater than volumetric leak rate or vapor generation rate.
needs to be at least 13 times greater than volumetric leak rate or vapor generation rate.
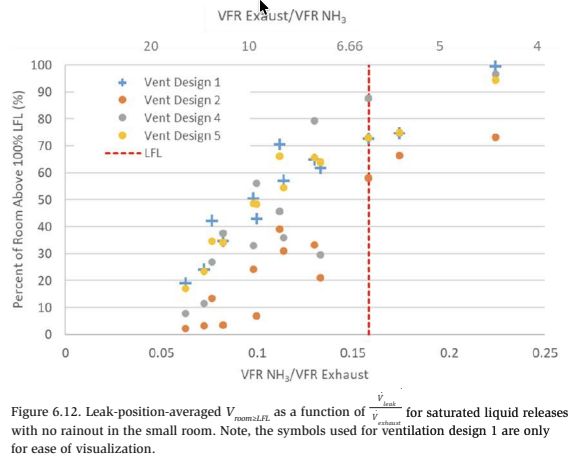
Figure 6.13 shows the results from the large room with the leak-position-averaged results. In the large room with high-efficacy ventilation designs 2 and 3, as long as ![]() is 0.1 or less (i.e.,
is 0.1 or less (i.e.,![]() needs to be at least 10 times greater than volumetric leak rate or vapor generation rate), Vroom≥LFL is on the order of 20%. For the other passive inlet ventilation designs (1, 4, and 5), higher ventilation rates are needed.
needs to be at least 10 times greater than volumetric leak rate or vapor generation rate), Vroom≥LFL is on the order of 20%. For the other passive inlet ventilation designs (1, 4, and 5), higher ventilation rates are needed.
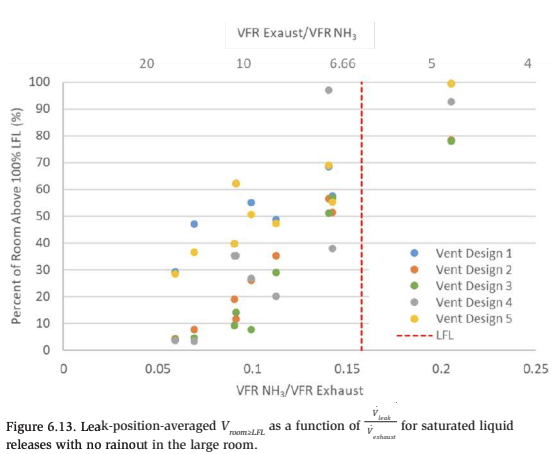
6.4.2 Partial Rainout
Impinged saturated liquid releases can have liquid rainout. The percentage of the release that rains out depends on the level of impingement and the temperature of the ambient conditions. The fraction that does not rain out evaporates near or downstream of the release location and the liquid that rains out and pools on the ground also evaporates and supplies additional ammonia vapor to the room.
Simulations were run with liquid rainout mass fractions of 25% and 50%. Recall that previously discussed subcooled liquid releases presented![]() ratios calculated using “vapor generation” from the pool evaporation as the “effective” leak rate. While this is justified for the subcooled liquid releases because nearly all of the release remains a liquid and forms a liquid pool of ammonia in the machinery room, it is not as readily applicable to saturated liquid releases with partial rainout. Given nearly all of the release for subcooled leaks results in pool formation and nearly all of the vapor generation within the machinery room is driven by the pool evaporation rate, it is therefore reasonable to design the emergency ventilation rates for subcooled liquid releases based on the “vapor generation” rate from the pool which was found to be significantly lower than the actual leak rate.
ratios calculated using “vapor generation” from the pool evaporation as the “effective” leak rate. While this is justified for the subcooled liquid releases because nearly all of the release remains a liquid and forms a liquid pool of ammonia in the machinery room, it is not as readily applicable to saturated liquid releases with partial rainout. Given nearly all of the release for subcooled leaks results in pool formation and nearly all of the vapor generation within the machinery room is driven by the pool evaporation rate, it is therefore reasonable to design the emergency ventilation rates for subcooled liquid releases based on the “vapor generation” rate from the pool which was found to be significantly lower than the actual leak rate.
However, for saturated flashing releases, the consequences of such releases can be either: (1) that the entire release completely flashes to vapor and the resulting “vapor generation” rate of ammonia in the machinery room would thus be exactly equal to the predicted leak rate; or (2) based on the position of the release, the leak impinges on a surface or equipment, resulting in partial liquid rainout from the release. Under this second condition, the “vapor generation” rate would be a combined contribution of the part of the liquid release that flashed to vapor and the part that rained out into a liquid pool, which is driven by the pool evaporation rate. While the vapor generation rate from the second condition will be less than the total leak rate, under practical design conditions it is not readily known the exact amount of rainout that will contribute to the liquid pool during the release, hence it would be challenging to rely on this for design cases a priori. Thus, the partial rainout simulations presented herein do not use the combined vapor generation of the flashing liquid with the evaporation rate from the pool for the calculated ![]() , and instead calculates it based on the total leak rate. As a result, the performance of each ventilation design in these scenarios is expected to perform better than the no rainout simulations.
, and instead calculates it based on the total leak rate. As a result, the performance of each ventilation design in these scenarios is expected to perform better than the no rainout simulations.
25% Rainout
Figure 6.14 shows the leak-position-averaged results in the small room with 25% rainout (full results available in Appendix C). With 25% rainout, ![]() values less than 0.158 produced Vroom≥LFL values on the order of 25% or less, or equivalently
values less than 0.158 produced Vroom≥LFL values on the order of 25% or less, or equivalently
![]() needs to be at least 6.3 times greater than volumetric leak rate or vapor generation rate. The ventilation design trends observed in the no rainout simulations were similarly observed in the 25% rainout simulations.
needs to be at least 6.3 times greater than volumetric leak rate or vapor generation rate. The ventilation design trends observed in the no rainout simulations were similarly observed in the 25% rainout simulations.
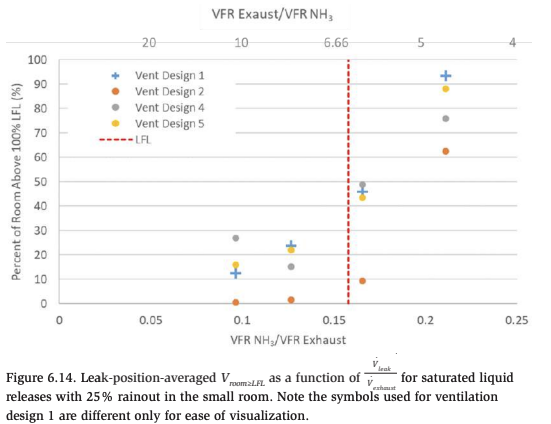
In the large room, with 25% rainout, leak rate to exhaust rate ratios less than 0.158 produced flammable volumes smaller than 25% of the room volume, or equivalently ![]() needs to be at least 6.3 times greater than volumetric leak rate or vapor generation rate. Again, the results from the large room with 25% rainout show similar trends to the 100% flashing vapor releases presented previously in Section 5.4.
needs to be at least 6.3 times greater than volumetric leak rate or vapor generation rate. Again, the results from the large room with 25% rainout show similar trends to the 100% flashing vapor releases presented previously in Section 5.4.
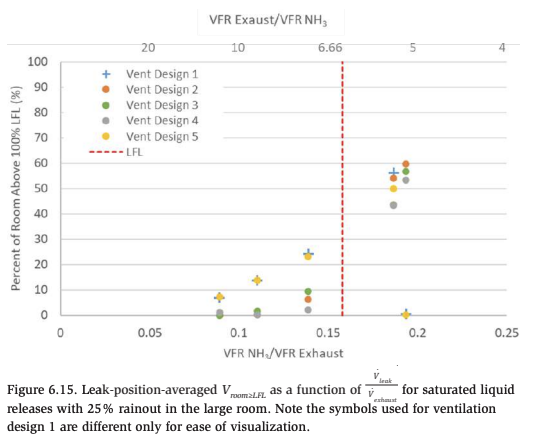
50% Rainout
The 50% rainout cases showed similar trends as the 25% rainout cases. The 50% rainout resulted in lower vapor production rates and thus resulted in smaller flammable volumes than both the zero rainout and 25% rainout cases.
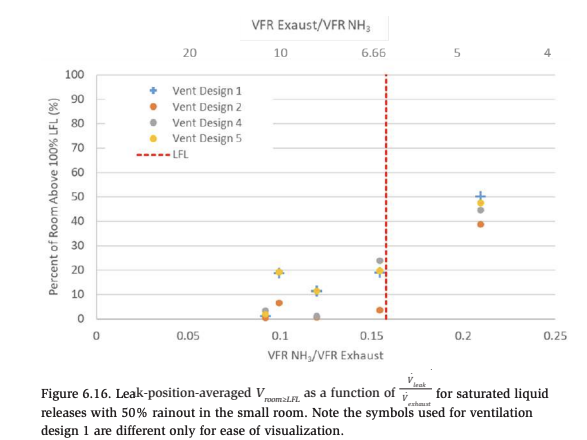
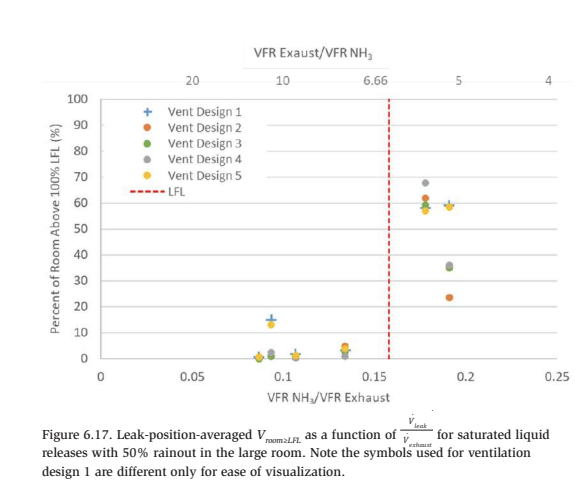
Partial Rainout Compared to No Rainout
Partial rainout results in a lower vapor production rate (e.g., lb/min or SCFM) because the mass evaporation rate from the pool is lower than the mass flow rate of liquid rainout supplying the pool. Any liquid that pools on the ground will have a lower vapor generation rate than if it flashes completely downstream of the source. Figure 6.18 and Figure 6.19 show ![]() as function of
as function of ![]() for ventilation design 1 in the small and large rooms when there is no rainout, 25% rainout, and 50% rainout. The other ventilation design plots are available in Appendix C. As the figures show, Vroom≥LFL at a given
for ventilation design 1 in the small and large rooms when there is no rainout, 25% rainout, and 50% rainout. The other ventilation design plots are available in Appendix C. As the figures show, Vroom≥LFL at a given ![]() decreases with increased rainout.
decreases with increased rainout.
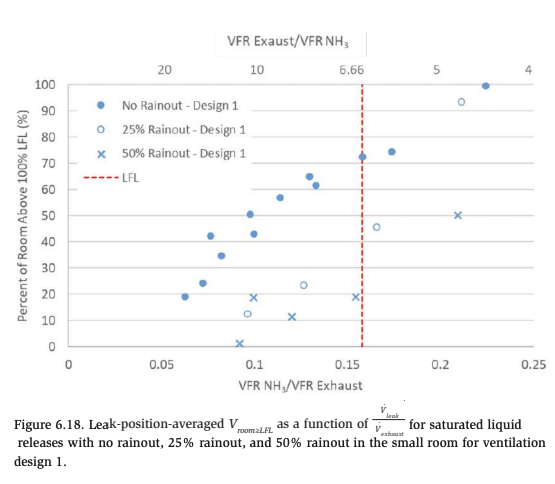
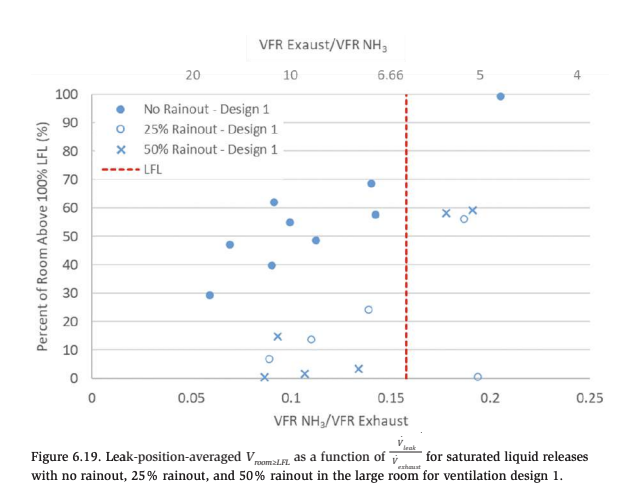
In both the small and large room, for all ventilation designs, Vroom≥LFL was always the largest for the cases with no liquid rainout. This result is expected because the ![]() for the partial rainout cases is based on the total leak rate, not the total vapor generation rate. The actual vapor generation rate is lower due to the formation of liquid ammonia pools slowing down the vapor generation rate and resulting in smaller flammable volumes being formed.
for the partial rainout cases is based on the total leak rate, not the total vapor generation rate. The actual vapor generation rate is lower due to the formation of liquid ammonia pools slowing down the vapor generation rate and resulting in smaller flammable volumes being formed.
6.5 Comparison of Leak Types
Figure 6.20 and Figure 6.21 compare the results for the superheated vapor, subcooled liquid, and saturated liquid releases with no rainout, 25% rainout and 50% rainout in the small and large room with ventilation design 1. Results for the other ventilation designs are provided in Appendix C. Overall, the saturated liquid releases with no rainout produce the highest Vroom≥LFL for a given ![]() in both the small and large room. Thus, saturated liquid releases with no rainout require the highest ventilation rates to mitigate.
in both the small and large room. Thus, saturated liquid releases with no rainout require the highest ventilation rates to mitigate.
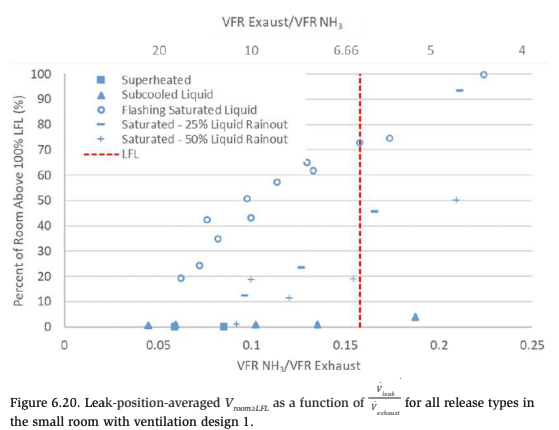
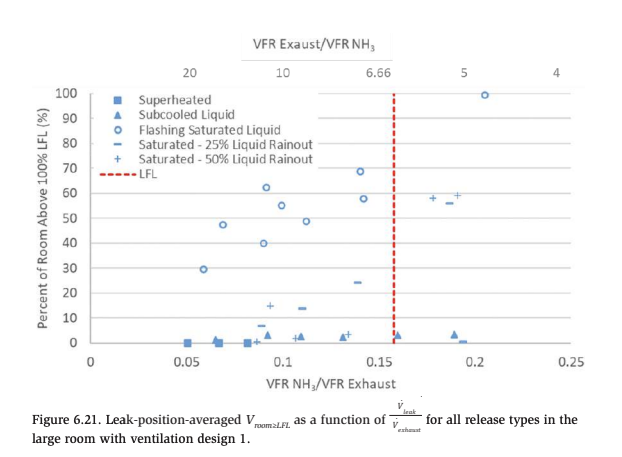
6.6 Design Cases
The saturated liquid releases with no rainout required the highest ventilation rates to keep Vroom≥LFL low. A summary of each of these design cases are shown in Figure 6.22 for the high efficacy designs. These were the two cases with ducted designs that facilitated mixing throughout the room and, most importantly, near the floor. This figure includes ventilation designs 2 and 3 and leak rate/exhaust rate ratios for both the small and large room.
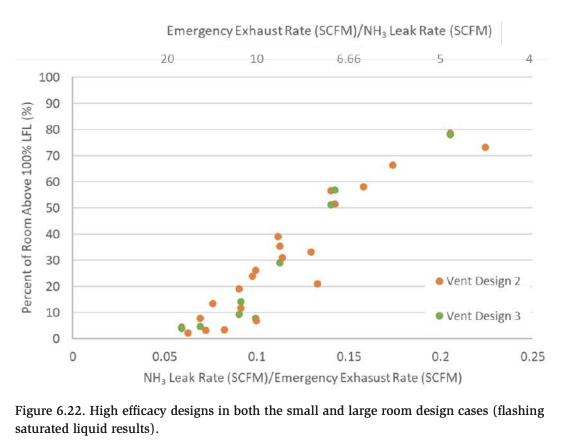
Figure 6.22 shows that for the high efficacy designs, an exhaust rate equal to approximately 10 times the volumetric leak rate or vapor generation rate will keep flammable volumes below 25% of the room volume. The results for the passive inlet designs are shown in Figure 6.23. This figure includes ventilation designs 1, 4 and 5 and leak rate/exhaust rate ratios for both the small and large room. These designs had no ducting or means of directing make-up air flow and were more prone to vapor accumulation.

Figure 6.23 shows that for the passive inlet designs, an exhaust rate equal to approximately 15-20 times the volumetric leak rate will keep flammable volumes below 25% of the room volume.
7. Summary of Findings
This study determined the necessary ventilation rates for ammonia releases from full-bore ¾” diameter line failures containing: 1) high temperature, high pressure liquid (i.e., saturated liquid); 2) low temperature, high pressure liquid (i.e., subcooled study was specifically limited to this condition. The study compared the performance of evaluate the rationale behind, nor the likelihood associated with a full-bore ¾” diameter release, hence, as mentioned above, the study was specifically limited to this condition. The study compared the performance of different emergency ventilation designs and determined the required emergency ventilation rate necessary to mitigate/minimize flammable cloud formation for each ventilation design and release scenario. System performance was evaluated based on the ability of the emergency ventilation design to limit the size of the flammable ammonia/air cloud to less than 25% of the room volume during the release.
The results of this study demonstrate that the release characteristics of saturated ammonia liquid, subcooled ammonia liquid and superheated ammonia vapor differ quite substantially. Superheated ammonia vapor releases result in either a buoyant jet of ammonia/air that readily mixes with air in the room, or if the jet impacts an object and loses its momentum, a low-momentum release that tends to rise due to buoyancy. Given superheated ammonia releases are in the gas phase, they result in the lowest overall leak rate amongst the three types studied for ¾” full-bore release and were predicted to be at a maximum of 80 lb/min. Given the entire release is a vapor, the volumetric vapor generation rate is equal to the leak rate.
Maximum leak rates of approximately 900 lb/min were predicted for subcooled liquid ammonia releases. Unlike the superheated vapor releases, the subcooled liquid releases almost entirely remained in the liquid phase. This results in a liquid pool that will spread across the floor, and the primary vapor generation is due to subsequent evaporation from the pool and not from the release. Therefore, the actual volumetric vapor generation rate is controlled by the evaporation of the liquid pool that forms on the ground and is significantly less than the actual leak rate. In addition, the liquid ammonia will evaporate at the vapor-liquid interface and this process will occur at the boiling point temperature of liquid ammonia, which is -28°F (-33°C). Hence given the molecular weight of ammonia, the resulting vapor generated will still be lighter than air and tend to rise towards the ceiling due to buoyancy.
The most challenging releases identified in the present study were the saturated liquid releases, because they resulted in not only the largest vapor generation sources but also because they could exhibit dense gas behavior. For example, when the saturated liquid release occurs directly from the vessel, liquid ammonia exits the orifice/opening and the mass flow rate is accurately approximated using incompressible flow equations and was predicted to be 800-900 lb/min, which if given enough unobstructed distance downstream of the release, can completely flash into vapor (i.e., vapor generation rate = leak rate). These releases also result in ammonia/air mixtures that are more dense than the ambient air that can migrate along the ground in contrast to superheated vapor or subcooled liquid releases.
When there is a certain length of pipe between the reservoir and the release point, the saturated liquid begins to flash in the pipe and thus a two-phase mixture exits the full-bore opening. The mass flow rate of the two-phase mixture is lower than if pure liquid exited. With just 4 inches of ¾” piping, the two-phase flow rate is approximately 300 lb/min as compared to a release from a vessel where the release rate is 800-900 lb/min. Again, if given enough unobstructed distance downstream of the release, the two-phase release can completely flash into vapor (i.e., vapor generation rate = leak rate); however, the resulting release may transition from dense gas to neutrally buoyant. While conditions exist for the saturated liquid releases to impinge on surfaces resulting in partial rainout of the liquid droplets, these releases do not generate as much vapor due the subsequent evaporation of the liquid, and for design purposes, the maximum vapor generation from such releases can be estimated from the leak rate.
The main result from the present study is regardless of the leak type (subcooled liquid, saturated liquid, and superheated vapor), leak rate or equivalent vapor generation rate (i.e., for subcooled releases), the emergency ventilation rate needs to be at least 10 times higher than the volumetric leak or vapor generation rate of ammonia for high efficacy designs in order to limit the size of the flammable ammonia/air cloud to less than 25% of the room volume during the release. These results do not correlate to ventilation rates defined as ACH. Recall high efficacy ventilation designs have ducted inlets designed to maximize mixing, and ensured the released ammonia was well-mixed and prevented pockets of flammable vapor from forming.
These results are largely based on the more challenging saturated liquid releases, which were not only determined to be the largest vapor generating release types but also more complicated due to their dense gas behavior. The dense gas behavior was better mitigated by designs which favored air flow near the ground. Other release types such as superheated vapor and subcooled liquids can be mitigated to similar flammable levels at lower relative ventilation rates to leak rates (i.e., less than 10 times higher than the volumetric leak or vapor generation rate), this multiplicative factor of 10 will cover the full range of release conditions. For passive inlet designs, or ventilation designs with no ducting and a passive make-up air opening(s) on the side of the room, the emergency ventilation rate requirement raises to between 15 and 20 times higher than the volumetric leak or vapor generation rate. For buoyant vapor releases (superheated vapor and evaporating subcooled liquid), there was little difference in the ventilation designs. The buoyant vapors rose to the ceiling to be exhausted out.
Required emergency ventilation rates for ammonia machinery rooms have conventionally been provided as an equivalent 30 Air Changes per Hour (ACH) of the machinery room. This means that the emergency ventilation rate is linked to the volume of the machinery room, for example 30 volumes of air must be provided per hour within the machinery room, and the emergency ventilation rate is not linked to the actual design release rate of ammonia. However, the resulting concentration of ammonia is related to the volumetric release rate or vapor generation rate of ammonia and the volumetric ventilation rate of the emergency fans. Hence if you have a similar leak rates in a small machinery room and large machinery room, the volumetric emergency ventilation rate for the smaller room will be less for the same 30 ACH. To demonstrate this, releases from the relatively low leak rate of the superheated vapor could easily be mitigated by the traditional 30 ACH criterion in the large machinery room, however this 30 ACH emergency ventilation requirement was inadequate maintaining flammable ammonia vapor clouds below the threshold criteria of Vroom≥LFL less than 25% in the small machinery room. Therefore, the more accurate requirement for emergency ventilation rates will be to scale the emergency fan rate to the volumetric leak or vapor generation rate.
Practically speaking, this means that in order to design an emergency ventilation system for a machinery room, the design volumetric leak rate or vapor generation rate must first be determined for the ammonia refrigeration and cooling system. This will require determining sections of superheated vapor, subcooled liquid and saturated liquid, their association process conditions and the type of releases possible from the associated equipment or piping. The present study only evaluated ¾” fullbore releases and determined the associated emergency ventilation rates necessary to mitigate such conditions. However, the power of the present study is regardless of the design volumetric leak rate or vapor generation rate, the associated emergency ventilation fan flow rate will need to be 10 times higher for high efficacy designs, and 15-20 times higher for passive designs. Note that these results are specific to the rooms and ventilation designs studied here (i.e., two room sizes and five ventilation designs). Additional work may be necessary to evaluate the sensitivity of the current results to other machinery room sizes and configurations.
Therefore, in order to reduce the fan requirements of the emergency ventilation system, ways to reduce the volumetric leak rates or vapor generation rates should be explored. For example, potential mitigation reduction strategies include: (1) minimizing liquid flow rates from high pressure saturated liquid lines by reducing line diameters, (2) reducing the release rate of saturated liquid lines by preventing failures less than 4 inches away from the source vessel (this reduced the maximum flow rate from 800 to 300 lb/min), (3) increase the amount of rainout and impingement for saturated liquid releases (shrouding or pipe-in-pipe), (4) eliminating thermosyphon and liquid injection oil cooling in favor of using water-cooled oil cooling and (5) adding automatic isolation valves that close when a release is detected.
Ambient temperature was shown to have little impact on the results and limiting potential releases to a fixed inventory proved to be effective at reducing the duration of volumes present above the LFL for very large releases. Lastly by changing the aspect ratio and position of the passive inlet geometries, performance can be improved from square inlets assumed in this study.
8. Future Work
Recommended future work falls into two categories: additional CFD modeling to further build the technical bases for ventilation designs and machinery room designs; and performing a quantitative risk assessment (QRA) in order to assess not only the consequence of all leaks including full-bore releases, but also evaluating the likelihood of such events.
Additional dispersion simulations modelling ammonia releases would verify that the recommendations developed from the simulations in this report are applicable to a broader range of leaks, specifically in a broader range of machinery rooms and ventilation designs. The rooms modeled here were relatively similar in their length, width and height aspect ratio. Further work should study rooms of long/narrow design or non-rectangular rooms. In addition, different ventilation designs could be implemented, or mitigation measures could be implemented. For example, including bunding or drains would mitigate pool surface area and resulting evaporation rate.
The present study did not evaluate the consequence of an ignition event with flammable concentrations of ammonia in the machinery rooms. Additional CFD simulations studying the overpressures and thermal exposures from an ignition of a flammable pocket of ammonia would add a foundation for the Vroom≥LFL 25% threshold used in the present study. Overpressure consequences are tied to both confinement and congestion. One potential additional benefit of the large ventilation rates, beside the reduced flammable cloud volumes, are the large areas required for make-up air. These large openings may allow for substantial pressure relief which could allow for a higher threshold flammable volume.
The current study only assessed ¾” full-bore releases and did not evaluate a range of releases that could occur ranging from a small crack to full-bore releases. The lower the design leak rate, the lower the design ventilation rate is required. For examples, the flow rates from a vapor only release are much smaller than releases from equivalent hole sizes of saturated and subcooled liquid lines. A quantitative evaluation of likely release rates may illustrate that the ¾” full-bore ruptures studied here occur infrequently and a smaller design release may be appropriate.
In addition, the likelihood of each scenario could be assessed directly along with its own consequences from a quantitative perspective via a quantitative risk assessment (QRA). For example, it may be shown that after reenforcing near the source vessel it will be far more likely that failures occur at least 10 cm from the source vessel. This would essentially reduce the leak rate for saturated liquids from 800 lb/min to 300 lb/min (again reducing the required design ventilation rate). Coupling historical or available release data with CFD simulation results will form a quantitative basis for determining relative risk (i.e., QRA). Then based on the results of the QRA, a design accidental release may be chosen, which may or may not be different from the releases modeled in the present study. Comparisons could then be made between the lowest tolerable design accidental to the worst-case full-bore releases.
9. References
Britter, R. W. (2011). Toxic industrial chemical (TIC) source emissions modeling for pressurized liquified gases. Atmospheric Environment, 45, 1-25.
Comittee for the Prevention of Disasters. (2005). Methods for the claculation of physical effects “Yellow Book.” The Hauge, NL.
Fauske, H. (1965). The Discharge of Saturated Water Through Tubes. Chemical Engineering Progress Symposium, 61(59).
Fauske, H. (1985). Flashing Flows or: Some Practical Guidelines for Emergency Releases. Plant/Operations Progress, 4(3), 132-134.
Timm, M. (2013). Case Study: Use of Dispersion Modeling Software in Ammonia Refrigeration Facility Design. 35th Annual Meeting International Institute of Ammonia Refrigeration, Technical Paper #6.
Appendix A.
Modeling flashing liquid releases in a room with FLACS The dispersion model in FLACS does not predict the fluid phase change (liquid to vapor) that occurs during a flashing liquid release. It only solves the conservation equations (mass, momentum, and energy) for gas/vapor fluid flow. An established and validated method exists for modeling flashing liquid releases in FLACS that involves defining the leak via a pseudo-source term. The pseudo-source term is essentially the condition at the distance downstream of the leak location where the jet no longer contains liquid and is a mixture of fuel (ammonia in this case) and air (see Figure A.1). This condition is defined as the leak source and FLACS predicts the resulting fluid flow and dispersion downstream and throughout the remainder of the simulation domain.
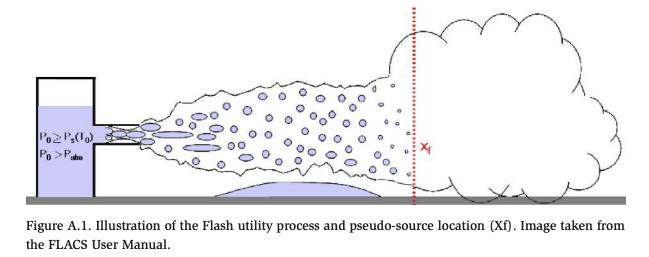
The traditional pseudo source inputs can be calculated using PHAST, FRED, or the FLACS flash utility. These tools all estimate the actual flashing/rainout process and provide the necessary release jet plume details for defining the pseudo-source in a FLACS dispersion simulation. The properties that make up the pseudo-source in FLACS are the distance downstream when the release no longer contains liquid, the concentration of fuel and air in the jet plume at this distance, the total mass flow rate at this distance, the cross-sectional area of the plume at this distance, and the mixture temperature at this distance. As illustrated in Figure A.2, the pseudosource is then defined as an area leak with the aforementioned parameters (i.e., location downstream of the actual leak location, volume fraction of fuel and air in the mixture, area, velocity, and temperature).
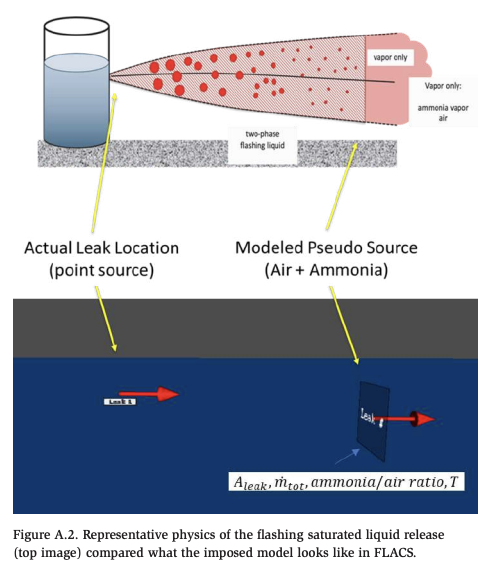
When the fluid released from a leak source in FLACS is a fuel/air mixture, as done with the existing method for modeling flashing liquid releases, air is released into the domain in addition to the fuel, whereas an actual flashing liquid release entrains the air around the leak into the downstream plume. This method works well for simulating flashing liquid releases that occur outdoors, but is less adequate for modeling indoor releases, especially when the intent of the modeling is to evaluate the effectiveness of a ventilation system like in the present study.
This is because the saturated liquid release rates considered in this study (up to 800 lb/min) entrain a large amount of air prior to the point where the jet plume no longer contains liquid (i.e., the conditions specified at the leak in FLACS). For example, the 300 lb/min release of ammonia entrains approximately 3,000 lb/min of air and thus a large quantity of air is artificially added to the room when defining the leak as a fuel/air mixture that is 9% ammonia by mass and has a leak rate of 3,300 lb/min. For this example, the leak adds air to the room at a rate on the order of the ventilation rates evaluated in this study. Under these conditions, all of the ventilation makeup air would essentially be coming from the leak and the resulting flow field would be completely different than when the makeup air comes from the passive air inlets.
For this reason, Gexcon developed a new method of specifying flashing liquid releases. The method does not artificially introduce air into the room. This is accomplished by specifying pure ammonia releases and changing other release parameters to approximately match the conditions at the location downstream of the release where there is no longer liquid in the plume. This method results in a similar pseudo-source, but the air in the mixture at this point has been entrained from the room and therefore no additional air is introduced into the room. In addition to changing various release parameters, we also implemented a volumetric heat sink downstream of the model that cools the ammonia/air plume as illustrated in Figure A.3. This is physically consistent with the cooling that occurs during a real flashing liquid release when the liquid flashes/evaporates to vapor (i.e., specified heat removal based on the mass flow rate of ammonia and enthalpy of vaporization)
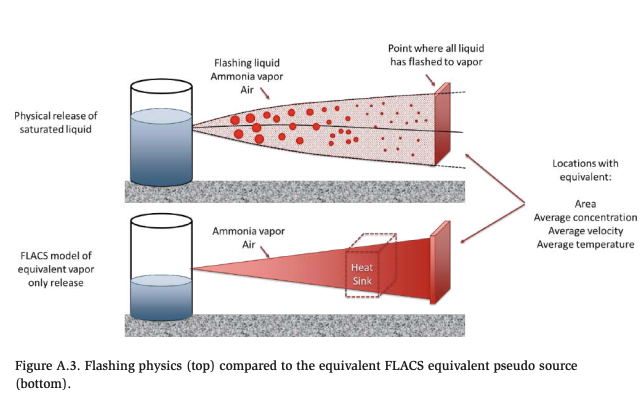
The partial rainout simulations were modeled matching the FRED predictions at the locations downstream of the leak where 25% and 50% of the liquid remained in the plume (i.e. locations where 25% or 50% of the liquid had not yet flashed as illustrated for the 50% case in Figure A.4). A FLACS vapor source and heat sink terms were modeled to match the ammonia vapor and air plume properties at these distances downstream of the leak. The remaining mass fraction of the leak (either 25% or 50%) was modeled with the FLACS pool model with a liquid source on the ground with the appropriate properties as shown for the 50% case in Figure A.4.
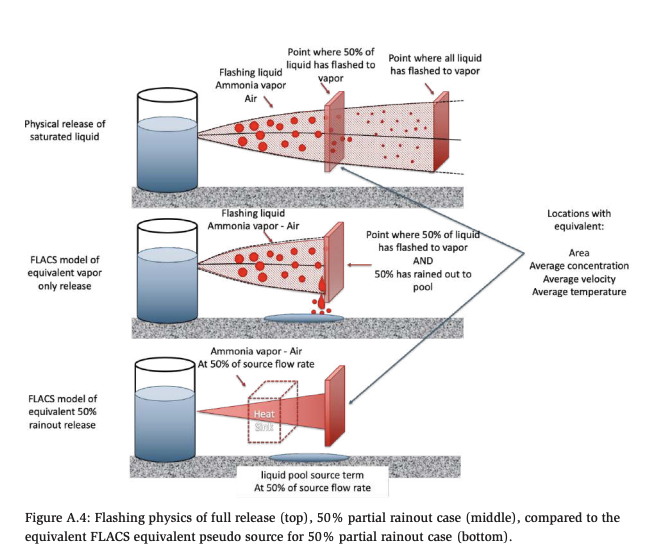
The near-field results yielded by the method were compared to FRED predictions of ammonia vapor concentrations downstream of the flashing liquid releases considered in this study. Figure A.5 shows that the method developed and applied in this study results in dense-gas behavior similar to what is observed in the FRED for the 300 lb/ min saturated liquid release. The FRED results are the contour line and the FLACS results are the solid colored regions. The colors for the FRED and FLACS results correspond to the same vapor concentrations. Note that the FRED simulation has a 1 m/s wind in the direction of the leak, and thus could be why the ammonia concentration contours extend farther downstream from the leak.
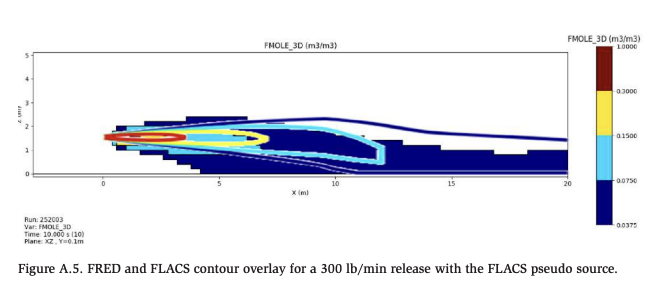
Appendix B. Sensitivities
Sensitivities were performed to evaluate the effect of: 1) a colder ambient temperature on the overall results; 2) limiting the available ammonia inventory during a leak; and 3) changing the aspect ratio of the passive air inlet in Ventilation Design 1.
B.1 Ambient Temperature
A select number of cases (one ventilation design and exhaust rate with three ammonia leak rates) were modeled with a cold ambient temperature of 0°F (-18°C). The intent was to evaluate whether the colder temperature of the make-up air would affect the buoyancy driven flow of the released ammonia and subsequently affect ventilation performance. As shown in Figure B.6 and Figure B.7, the temperature of the ambient air had very little influence on ![]()
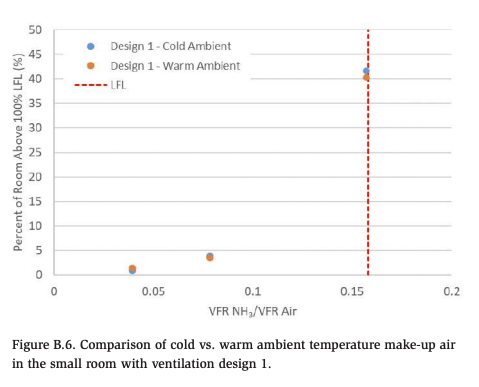
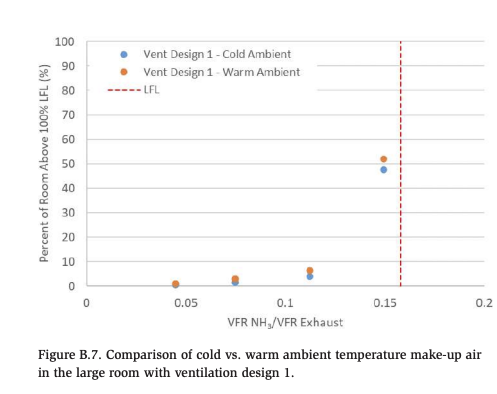
The select number of cases run with the colder make-up air showed that it had a minor to negligible effect on the flammable volume accumulation in the machinery rooms.
B.2 Fixed Release Inventories
Additional simulations were performed to understand the impact of limiting ammonia inventories released during a leak (i.e., limiting the total mass released). Simulations were performed in the small room, with ventilation designs 1 and 2, with superheated vapor releases ranging from 200 lb/min to 800 lb/min, and with ventilation rates of 10,000 CFM [30 ACH] in the small room and 21,000 CFM and 52,500 CFM [12 and 30 ACH] in the large room.
The simulations showed that limiting the total mass of ammonia release during a leak does not significantly change the peak ![]() or stedy state
or stedy state ![]() and thus does not significantly reduce the potential consequence of an ignition event. It does however reduce the duration during which the peak Vroom≥LFL or steady state Vroom≥LFL exists and thus it reduces it potentially reduces the likelihood of an ignition event. Examples of these time- Vroom≥LFL are shown in Figure B.8 and Figure B.9 for the small and large rooms, respectively. For the small room, when limiting the ammonia inventory (i.e., releasable amount of ammonia) to 500 lb, Vroom≥LFL ≥ 5% existed for approximately 250 s to 300 s for all scenarios modeled. When limiting the ammonia inventory (i.e., releasable amount of ammonia) to 1000 lb, Vroom≥LFL ≥ 5% existed for approximately 250 s to 300 s for all scenarios modeled.
and thus does not significantly reduce the potential consequence of an ignition event. It does however reduce the duration during which the peak Vroom≥LFL or steady state Vroom≥LFL exists and thus it reduces it potentially reduces the likelihood of an ignition event. Examples of these time- Vroom≥LFL are shown in Figure B.8 and Figure B.9 for the small and large rooms, respectively. For the small room, when limiting the ammonia inventory (i.e., releasable amount of ammonia) to 500 lb, Vroom≥LFL ≥ 5% existed for approximately 250 s to 300 s for all scenarios modeled. When limiting the ammonia inventory (i.e., releasable amount of ammonia) to 1000 lb, Vroom≥LFL ≥ 5% existed for approximately 250 s to 300 s for all scenarios modeled.
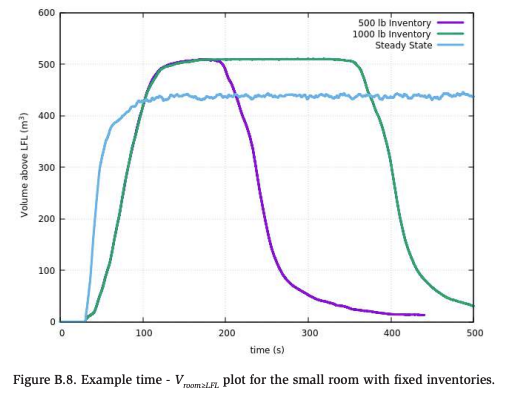
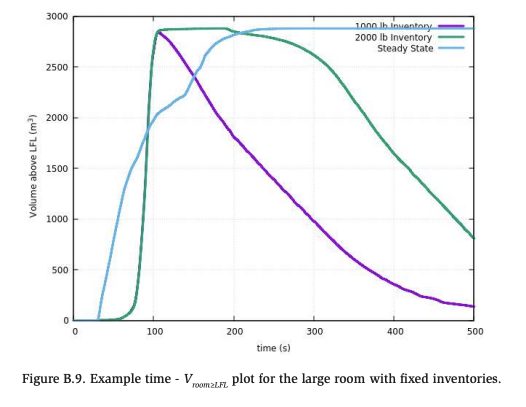
B.3 Alternative Ventilation Design 1
Additional simulations were performed to evaluate whether changing the aspect ratio of the passive air inlet in Ventilation Design 1 influences the performance. The aspect ratio was modified and the inlet area was held constant. The aspect ratio was changed to facilitate additional airflow near the bottom of the machinery room for the saturated flashing liquid releases which are known exhibit dense-gas behavior. Figure B.10 shows the original and modified passive inlet areas. As shown in Figure B.11 and Figure B.12, better performance can be achieved by using aspect ratios which facilitate airflow closer to the floor.
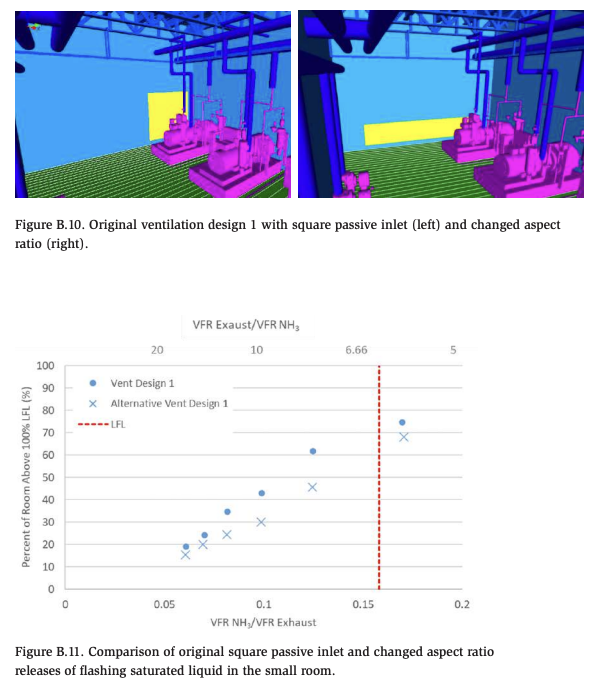
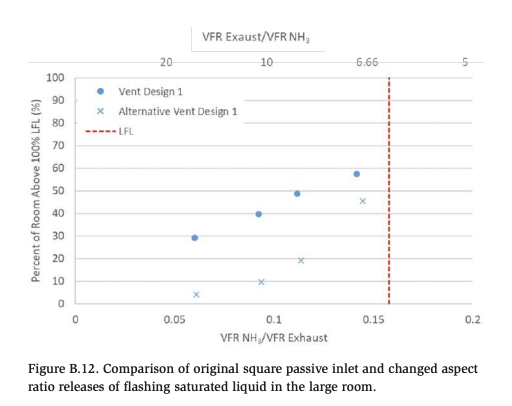
Appendix C. Additional Results Figures
Superheated Vapor
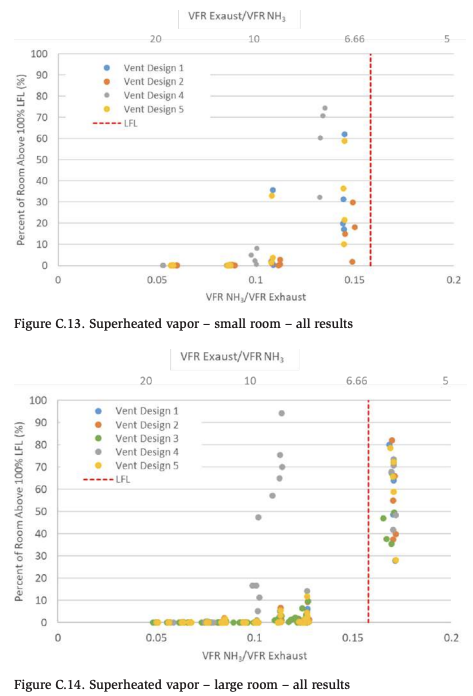
Subcooled Liquid
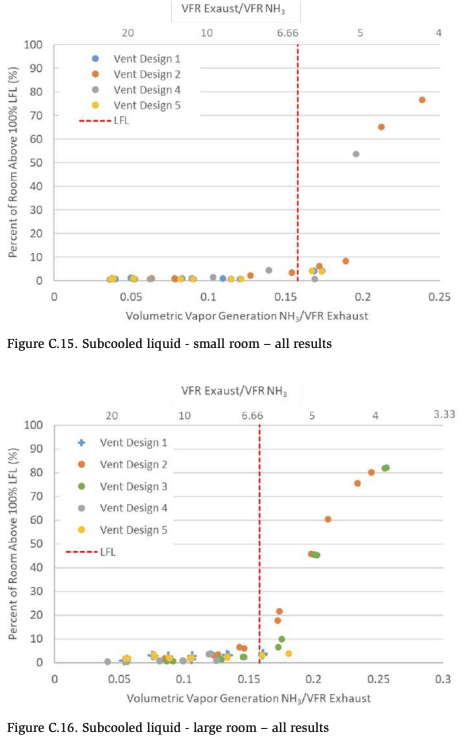
Flashing saturated liquid
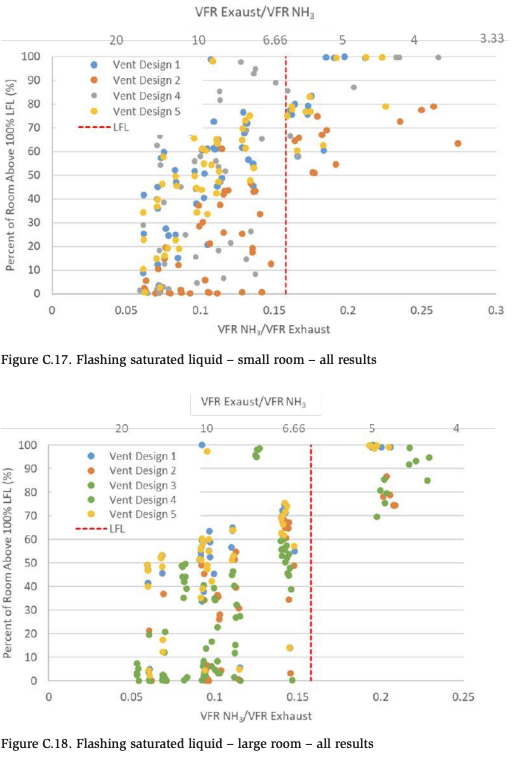
25% Rainout flashing saturated liquid
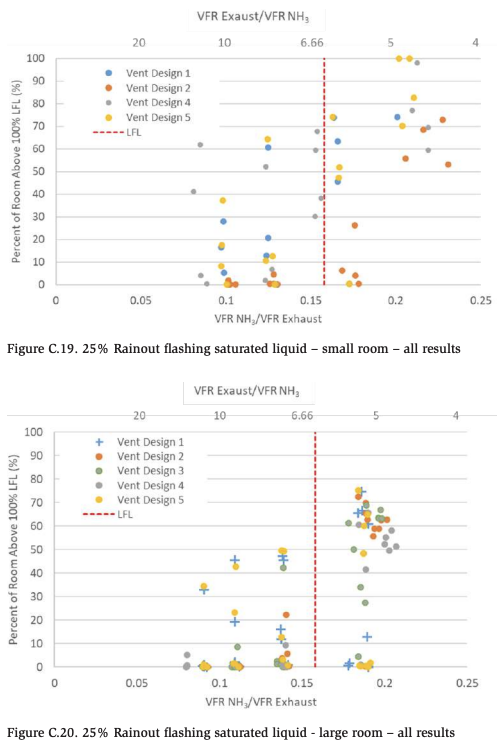
50% Rainout flashing saturated liquid
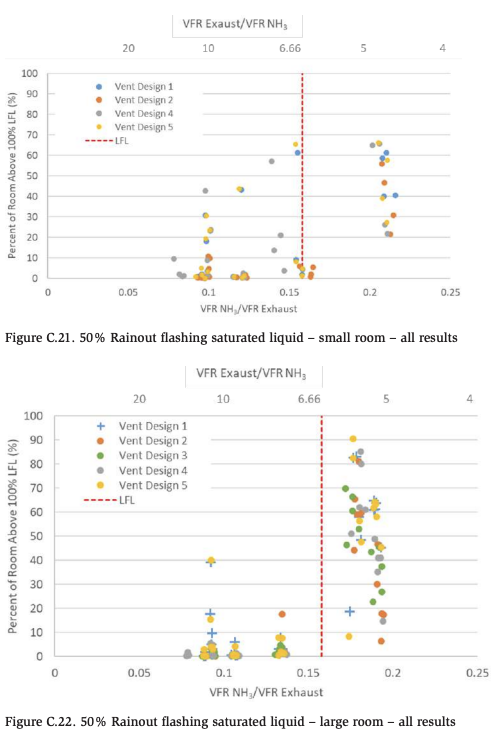
Comparisons for All Leak Types in the Small Room
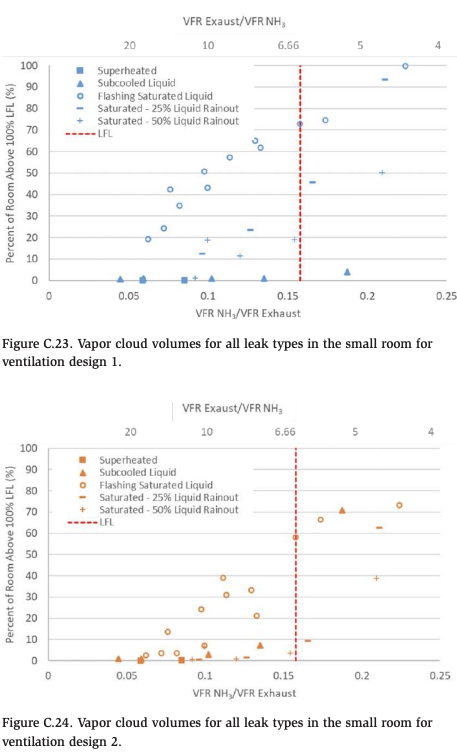
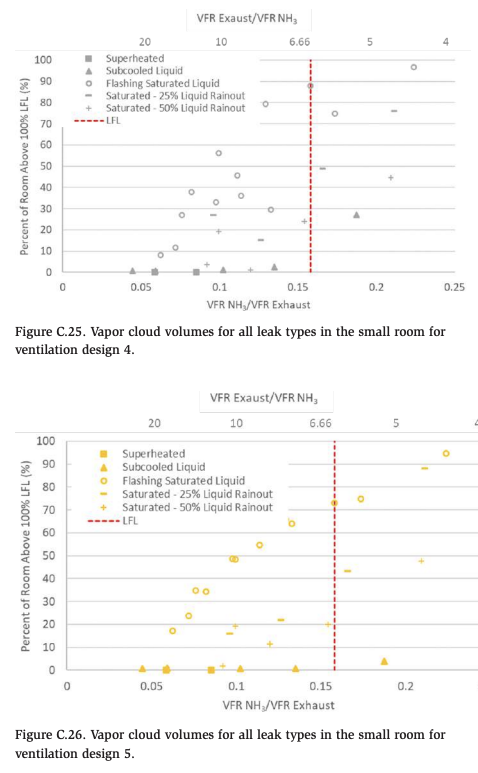
Comparison for All Leak Types in the Large Room
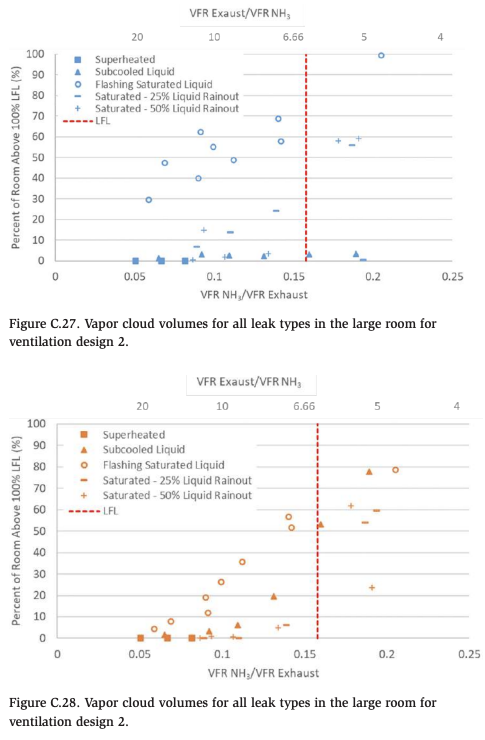
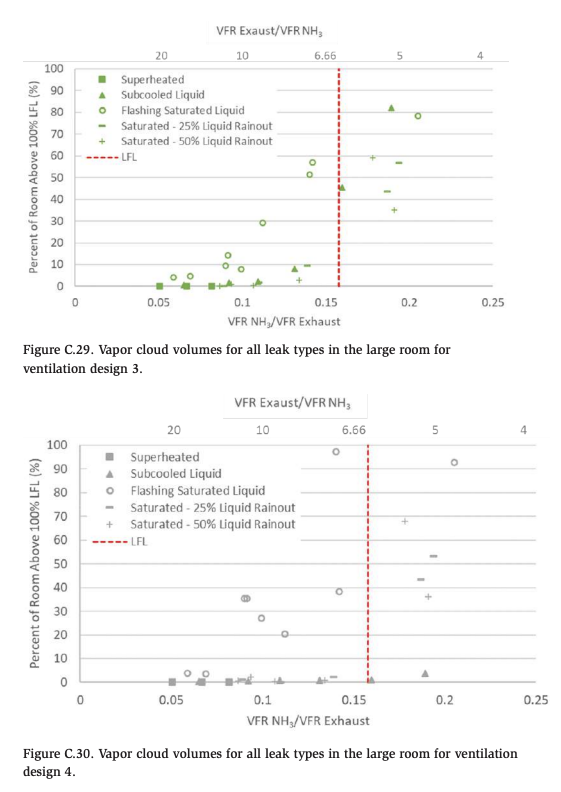
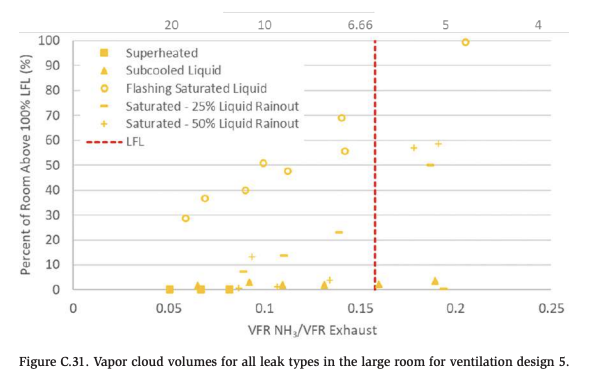
Appendix D. Simulation Matrices Summary
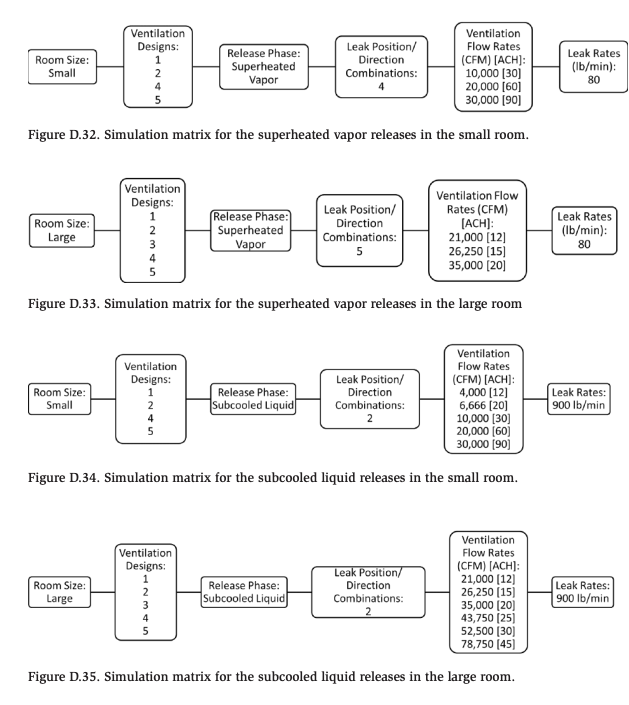
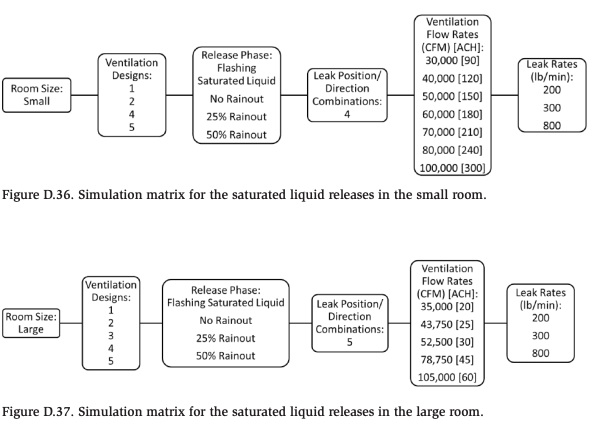
DISCLAIMER
This report was prepared by Gexcon US, Inc. for the International Association of Ammonia Refrigeration (IIAR) and the Ammonia Refrigeration Foundation (ARF). The material in it reflects Gexcon’s best engineering judgment in light of the information available to it at the time of preparation. Any use which a third party makes of this report, or any reliance on or decisions to be made based on it, are the responsibility of such third party. In no event shall Gexcon, or its respective officers, employees be liable for any indirect, incidental, special, punitive or consequential damages arising out of or relating in any way to decisions made or actions taken or not taken based on this report.