


2022 Technical Paper #9
Transcritical CO2 Compressors: Technical Challenges in Industrial Refrigeration Application
Author:
Giacomo Pisano, M. Eng. DORIN USA
Abstract
Carbon dioxide (CO2) has today become the standard refrigerant of choice for many applications, often enabling better coefficient of performance (COP) than the previously adopted technologies based on other refrigerants. This trend is progressively leading to both a lower usage of high global warming potential (GWP) refrigerants and sensible energy expenditure reductions in several industrial sectors [1]. However, specific components and appropriate system design are mandatory when approaching CO2 technology, due to the unique thermodynamic characteristics of this refrigerant.
In particular, CO2 transcritical compressors have to be engineered with a “from scratch” approach, this ending in the introduction of many technical solutions pertaining to the automotive sector (e.g., combustion engines). This work deals with and describe the challenges and the technical compressor developments involved with the design of CO2 transcritical compressors with displacements up to 4,412.00 cfh and 160 hp, specifically engineered for industrial refrigeration applications.
Introduction
Transcritical CO2 compression leads to very large differential pressures. For this reason, reciprocating (piston) compression technology seems to be the most effective, reliable, and durable versus other technologies (e.g., rotative). In fact, in a typical rotative compression process, the sealing between the high pressure (HP) and low pressure (LP) sides is assured mainly by the lubrication oil: during operation, especially in case of high heat sink temperatures, a CO2 refrigeration system features differential pressures as large as 80 bar (1160 psi) and in case of rotative compressor technology, leak-back from HP to LP vanes may deteriorate compression performance and reliability. On the other hand, reciprocating (piston) compression technology may intrinsically offer a high quality sealing thanks to the typical execution featuring one or more compression rings fit on the piston external skirt, thus offering a formidable way to consistently decrease the leak-back from the compressor HP side to its LP side.
In addition to high pressure gas leak-back, oil carry over is also another crucial design parameter when designing a CO2 transcritical compressor: with lubricant being the main sealant between the HP and LP sides of a rotative compressor, the oil circulation rate occurring for rotative compressors is normally higher than what is in place for reciprocating technology, where dedicated oil scarper ring fit on the piston skirt assures lubricant is scratched from cylinder walls and returned to the oil sump.
In light of these two aspects (lower leak back, lower oil carry over) it is understandable why, to date, reciprocating compressors are the most adopted compression solution for larger scale transcritical CO2 applications, this technology being investigated in the course of this paper for the development of large size CO2 compressors, up to 4,412 cfh and 150 hp.
CO2 Challenges from a Compressor Perspective
Taking into proper consideration the thermo-physical properties and the fluid dynamical features of carbon dioxide, it clearly appears how the compressor must be engineered with specific features and advanced design solutions. Particular mention should be made about the following parameters, which are the drivers for a proper understanding of the challenges to be overcome for an appropriate and durable compressor design.
Differential Pressures
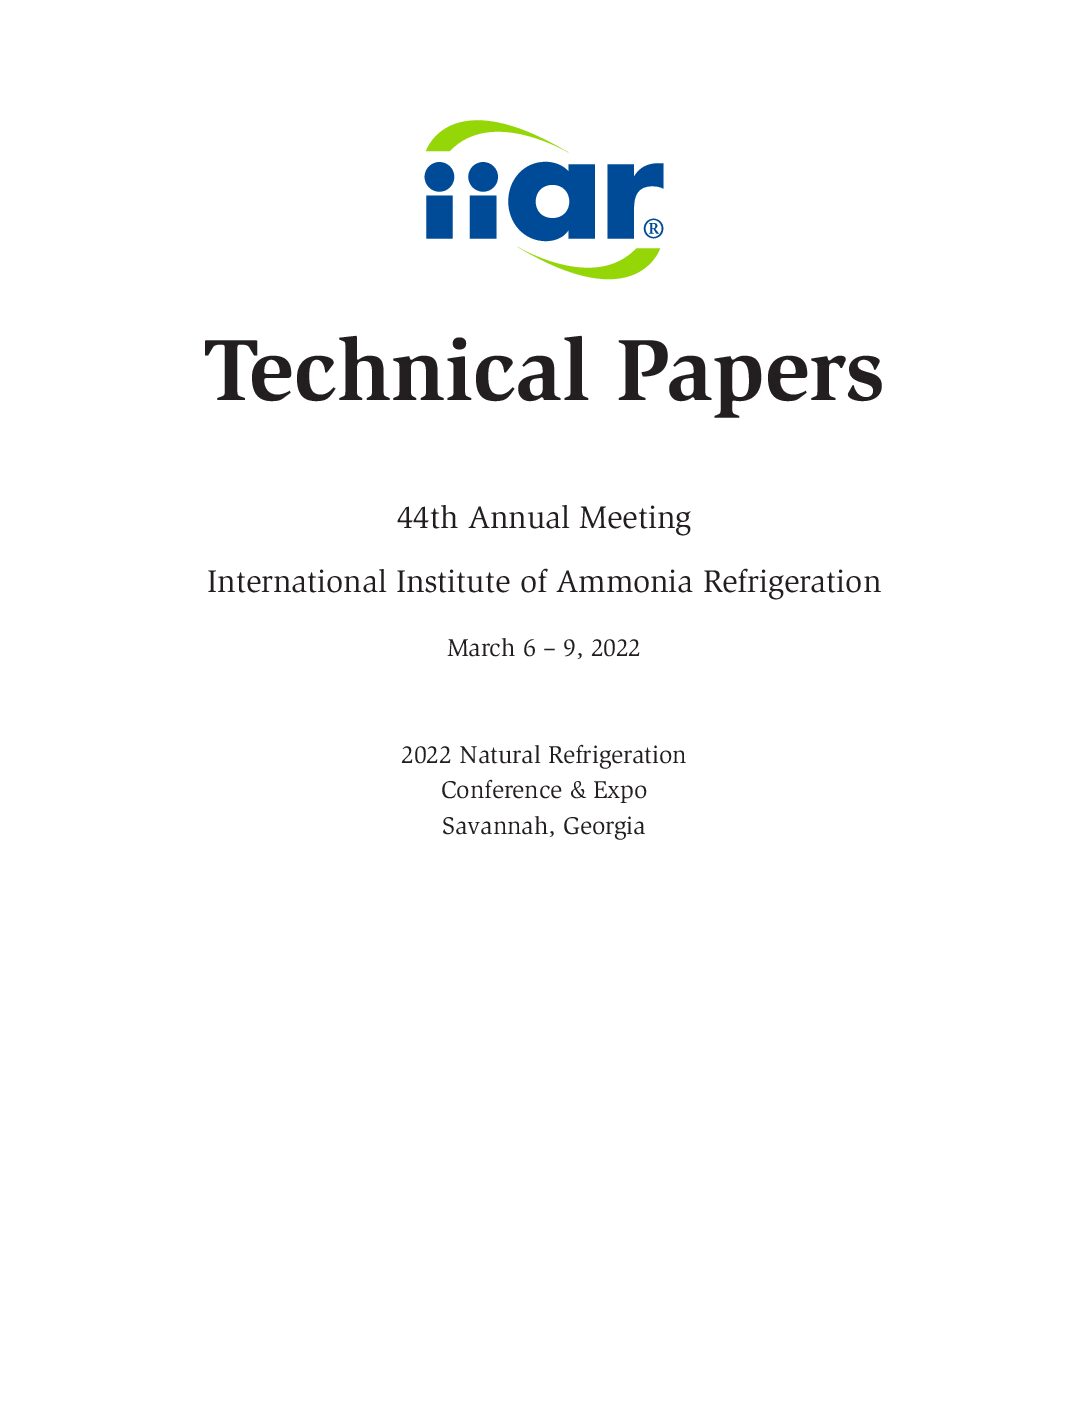
CO2 transcritical systems feature much larger differential pressures when compared to other refrigerants. Table 1 shows a comparison between pressure differential induced in a compressor by a typical medium temperature (MT) system operation, rated at -10°C (14°F) SST and 40°C (104°F) ambient temperature.
CO2 induces a pressure differential which is up to 6.5 times larger than the other refrigerants, this leading to much more severe challenges when designing the compressor drive gear.
Volumetric Refrigeration Capacity
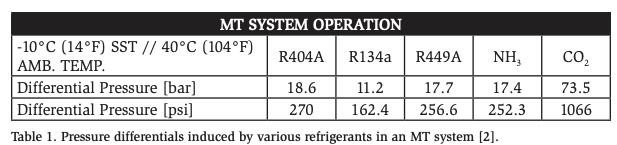
Carbon dioxide volumetric refrigeration capacity is much larger than other refrigerants, this being true in a variety of evaporating temperatures, see Figure 1 [3].
For instance, from -50°C (-58°F) to 5°C (41°F), CO2 offers a volumetric capacity which is 4 to 12 times higher than NH3, this meaning that given a certain refrigeration duty carbon dioxide compressor displacement (and system piping diameters) are typically smaller versus other refrigerants, and as a consequence smaller displacements lead to smaller reciprocating compressor bores.
Specific Load on the Drive Gear
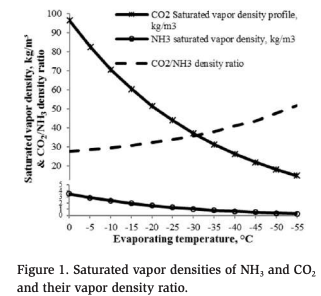
Given the characteristics described above, it is immediately understandable how CO2 transcritical operation induces a much larger specific load in the compressor drive gear, with the wrist pin being one of the most challenging components: the wrist pin engages the connecting rod small end on its center and the piston on its sides and needs to be able to win the force generated by the pressure differential between the LP and HP sides. With reference to Figure 2, it is interesting to compare the compressor wrist pin specific load generated by various systems using different refrigerants.
The following formula can be used to calculate the wrist pin specific load (p) for the various refrigerants systems:
p = F / A
Where:
F = differential pressure * piston top surface area
A = contact surface between wrist pin and con rod small end
CO2 compressors feature smaller bores, therefore less space is available to support the wrist pin during its stroke toward the top dead point. Table 2 shows a comparison between the specific load (p) induced by various refrigerants reciprocating compressors delivering about 140 kW (478 kBtu/h) refrigeration capacity in typical MT conditions.
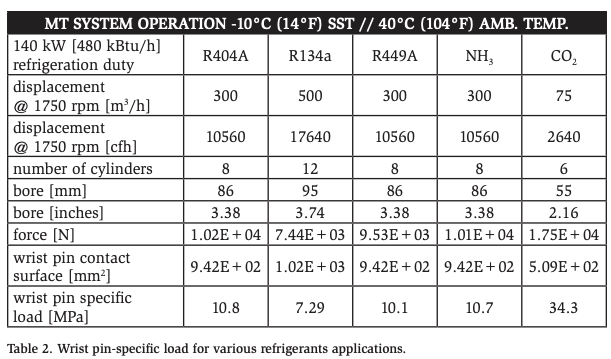
Table 2 shows how the wrist pin-specific load is much larger in CO2 compressors: approximately three times when compared to R404A, R449A and NH3, and approximately five times when compared to R134a. It is therefore understandable why the wrist should be considered one of the most crucial components for safe and durable CO2 transcritical compressor operation. Reliable compressor design will be strongly dependent on how well the lubrication is performed, especially at the wrist pin level. The following sections highlights how different compressor designs will significantly impact wrist pin wear rate during qualification life testing operation.
High Discharge Temperatures
When a gas undergoes a reversible process, this process frequently takes place in such a manner that a plot of log P vs. log V is a straight line, thus leading to the following equation:
PVn = constant
where n is defined as the polytropic exponent.
If we assume the process is fully reversible and if we assume constancy for specific heats, n is equal to the ratio of the same specific heats:
n = Cp/Cv.
where Cp is the specific heat at constant pressure and Cv is the specific heat at constant volume.
The polytropic exponent is typically used to calculate the isentropic discharge temperatures (IDT); table 3 lists various refrigerants IDT values for typical medium temperature (MT) refrigeration systems [4], [5].
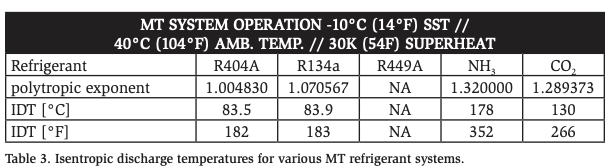
It is therefore clear that IDT increases with increasing polytopic exponent: for instance, the thermal compression load developed when using ammonia in the aforementioned operating conditions calls for additional means (e.g., condenser water cooling) in order to mitigate discharge temperatures. But when evaluating end of compression temperature, one should also consider that IDT values do not take into account the compression mechanical losses and eventual electric motor heat transfer to the refrigerant for suction gas cooled compressors, typically occurring with semi-hermetic or hermetic design. In fact, the real discharge temperature (RDT) will be higher than the isentropic by a factor which is a function of how efficiently the compressor performs in real life operation. Therefore, it is even more important to consider real life operations, keeping the same boundary conditions as in Table 3. Table 4 shows real discharge temperature values as calculated by publicly available compressor software.
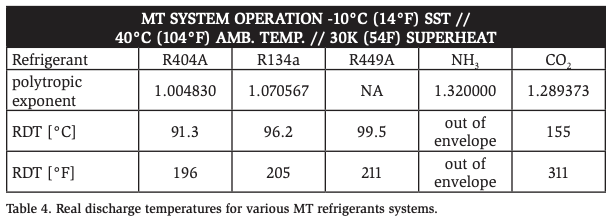
When compared to other refrigerants, CO2 induces a much higher thermal load inside the compressor: therefore, a very specific concern for lubrication effectiveness is needed, as will be shown in the following sections.
Lubricant Solubility in CO2
Lubricant dilution into the refrigerant is also a key parameter when approaching the design of CO2 compressors and the specific behavior of oil-to-refrigerant miscibility curves should be taken carefully into account. CO2 solubility into POE lubricants is very high, this is why the CO2 refrigeration oil viscosity grade is typically higher than other refrigerants: for instance, Figure 3 shows refrigerant content into the lubricant, using the Daniel plots for R134a and POE55 mixture and comparing those with CO2 and POE85 mixture [6].
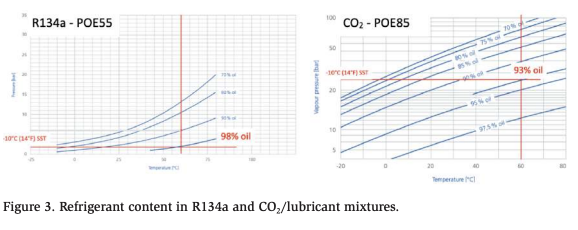
CO2 will therefore contain much more lubricant, this leading to some critical aspects such as lower residual viscosity and higher oil carry over, which will both be analyzed in the following sections.
CO2 Compressor Designs
A solid and durable compressor design shall bear in mind the various challenges described in section 3; the following sections provide a particular focus on the high thermal load and on the large refrigerant solubility into the lubricant. With this in mind, several designs for large size transcritical CO2 compressors have been developed and tested, with displacements up to 102 m3 /h (4412 cfh) and motor powers up to 150 hp.
Compression Heat Dissipation
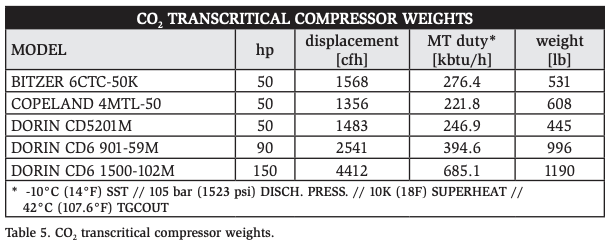
The very high thermal load developed during CO2 compression is extremely challenging when it comes to the design of large capacity transcritical compressors. More and more industrial refrigeration is focusing on transcritical CO2 applications for various reasons [7] and this leads compressor manufacturers to develop larger compressors to cope with the big refrigeration duties involved in the industrial refrigeration sector. Increasing the compressor size typically involves larger electric motor diameters, larger housings and bigger weights: table 5 shows various technical features from various compressors that can be found in the marketplace, including weights and refrigeration capacities in typical medium temperature (MT) conditions.
Moreover, consider that compressor housings are typically made of cast iron, which is a great conductive material; bigger compressors weights, obviously involving more cast iron, bring more challenges in dissipating the generated heat during the compression work. Dissipating this heat is extremely important, otherwise the compressor’s inner thermal level becomes intolerable and will lead to premature compressor failure.
With this in mind, two large transcritical CO2 compressor designs were developed and tested, with displacements up to 102 m3 /h (4412 cfh) the testing equipment, design of experiments (DoE), and test results will be discussed.
A first design (herewith referred to as Design A) is made in a similar way to what is in place with common HFC compression technology. HFC refrigerant compressors typically have a discharge plenum that is embedded into the compressor crankcase; Figure 4 shows Design A compressor and Figure 5 shows its interior view with a focus on its high-pressure side.
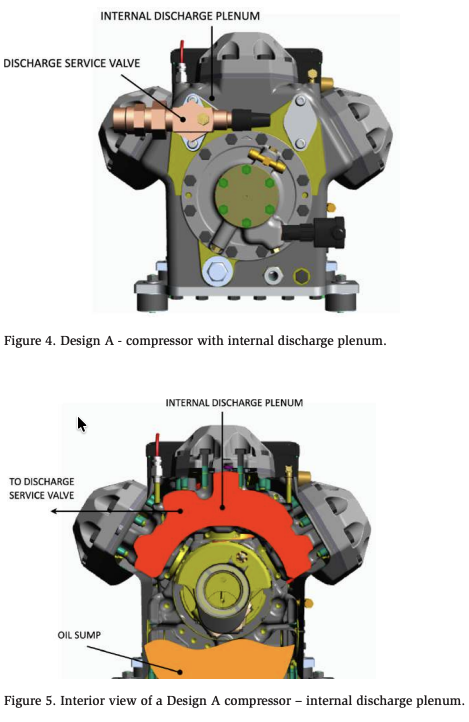
These figures show how, after being compressed, the gas is conveyed into an internal discharge plenum, with the discharge service valve being flanged onto the internal discharge plenum. The discharge plenum is therefore embedded into the compressor crankcase and contains the hot gas that has been compressed: analyzing this HFC-like design, it is reasonable to foresee that a large amount of the compression heat will be rejected into the compressor sump containing the lubricant, due to the following reasons:
- Discharge temperatures are significantly higher in CO2 transcritical applications than in HFC applications (§ 3.4)
- Compressor crankcase and discharge plenum walls are made of cast iron, which conducts the heat toward the oil sump as this is located close to the discharge plenum.
Dissipation of excessive compression heat into the oil sump can lead to high oil temperatures, resulting in a significant oil viscosity drop and thereby compromising compressor reliability and severely shortening its lifetime. As a result, any possible means to avoid large heat rejection toward the oil sump should be investigated.
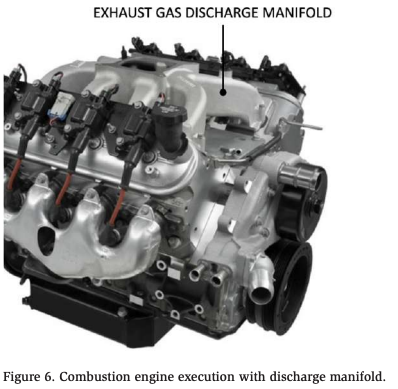
Having in mind other industrial sectors such as automotive combustion engines, one may think that similar design issues connected to heat dissipation have been already addressed and solved. In fact, combustion engines typically develop very high temperatures within the exhaust gases, from 400°C (752°F) in idling conditions up to 1200°C (2192°F) in full load conditions [8]; exhausts are then conveyed into an external plenum normally named a discharge manifold. In this way, high exhaust discharge temperatures are physically separated from the oil sump, helping in minimizing the heat rejection from the exhaust gas toward the lubricant and thus managing to keep the oil fresher and with a correct viscosity grade. Figure 6 shows a typical execution for a combustion engine where the discharge manifold is external to the crankcase and visible on top of the cylinder banks.
Having this in mind, a second design has been developed (herewith referred to as Design B). This design features a similar approach to combustion engine engineering, having adopted the use of an external discharge manifold; Figure 7 shows the design B configuration, while Figure 8 shows a detailed cross section of the external discharge manifold principle of operation.
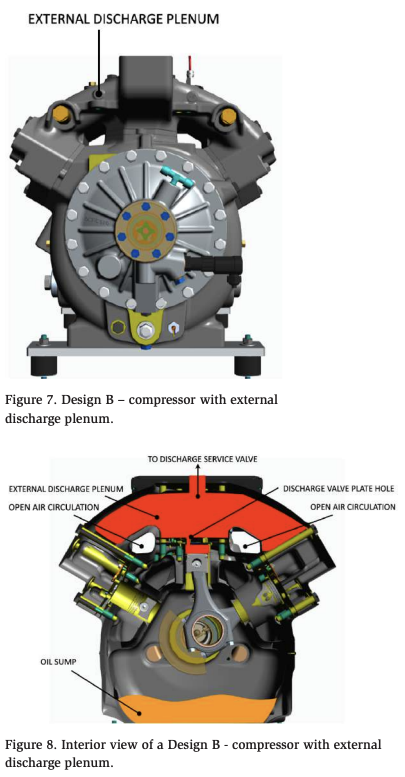
The interior view shows the refrigerant stream inside the compressor: after being compressed, CO2 flows from the piston top through the discharge valve plate hole, is conveyed into an outer volume, named the external discharge manifold, to exit the external manifold through the discharge service valve. Looking at Figure 7, two specific areas are also clearly visible: in fact, the external discharge manifold has been engineered in a way to let surrounding ambient air to thermally insulate the hot gas discharge external plenum against the oil sump.
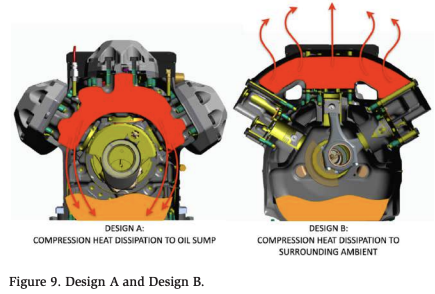
Design A and Design B are put aside in Figure 9. This clearly shows how Design B is likely to lead to lower oil temperatures, especially during transcritical operation, when end of compression temperatures are very high. In fact, Design B allows for much better compression heat dissipation toward the surrounding ambient, while Design A brings to a strong compression heat dissipation into the oil, likely contributing to a strong deterioration of its lubricating properties. Section 6 will show Design A and Design B test results, with a special focus on lubricant temperatures and residual viscosity.
Compressor Oil Circulation Rate (OCR)
CO2 transcritical technology is more and more being considered as a valid option for industrial refrigeration systems [9], which often feature very long pipe runs from the refrigeration rack to the evaporators. This means that oil management is a crucial aspect for safe and reliable system operation; therefore, compressors’ OCR (oil circulation rate) becomes a driver when designing an adequate CO2 compressor platform. OCR should be kept to a minimum [10] not only because it obviously assures safety, but also because it allows higher system efficiency, for the following reasons:
- Less lubricant film is distributed into the heat exchanger coils, thus assuring better heat transfers within evaporators and gas cooler.
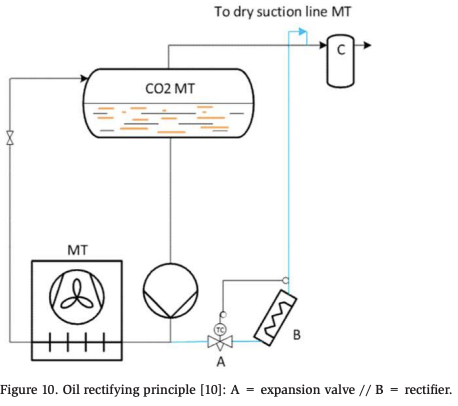
- In the case of pumped systems, oil is normally recovered with a rectifier [10], as shown in Figure 10: every time this happens, liquid CO2 bypasses the evaporator to flow to the rectifier and pump energy is “wasted” to the rectifier instead of being used for evaporator feeding. Having a high OCR will therefore lead to larger energy loss.
In the case of decreasing OCR, two additional compressor designs have been investigated, namely Design C and Design D. Both of them are based starting from the previously described Design B (external discharge manifold): the reason for this is because later sections will show how Design B overperforms Design A in terms of compressor reliability and efficiency.
Design C closely follows what is normally in place with HFC compressor design, as shown in Figure 11.
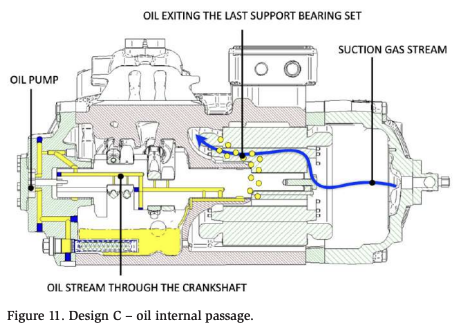
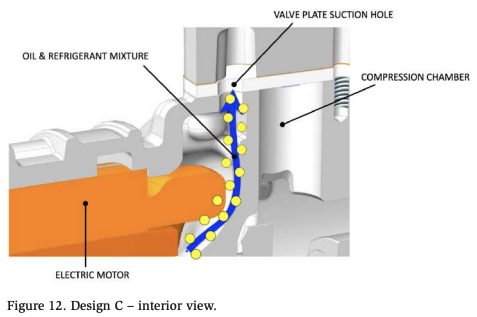
Figure 11 shows compressor Design C’s lubrication operating principle: a gear oil pump engages the crankshaft and sucks the lubricant from the compressor sump. Oil is pumped through the shaft oil feeding holes, lubricating the pump cover bearings, the connecting rods and the electric motor support bearings. After having lubricated this last set of bearings, oil is entrained by the suction gas stream, bringing it into the compression chamber and then being discharged toward the system in a high pressure line. Figure 12 shows a compressor interior view, better explaining how oil is entrained by the suction gas stream.
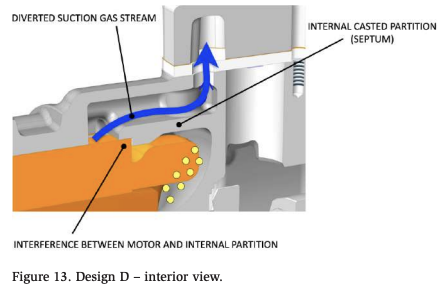
In order to decrease the oil entrained by the suction gas stream, Design D was developed with compressor crankcase being engineered in a way to allow the suction gas stream bypassing the main oil through area, which is located at the end of the motor bearing supports. Design D features an additional internal partition (septum) with stator interference execution throughout the complete crankcase annulus, which diverts the CO2 suction gas stream and allows for much lower oil entrainment, therefore acting as an internal oil separator, as shown in Figure 13.
Testing Equipment
In order to test the various compressor designs, a CO2 transcritical test rig has been used, its basic P&I diagram being shown in Figure 14.
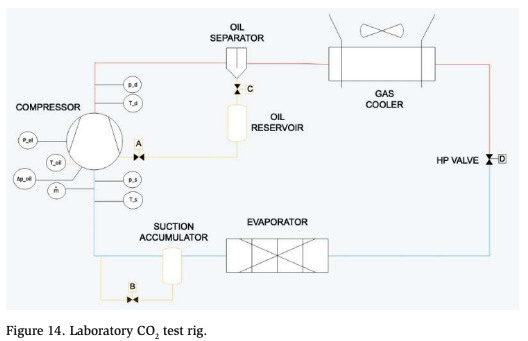
The following measurements and controls are performed:
- p_S: suction pressure
- T_S: suction temperature
- m: refrigerant mass flow
- ∆p_oil: oil differential pressure
- T_oil: oil temperature
- P_el: power consumption
- p_D: discharge pressure
- T_S: discharge temperature
- Valve A: allows compressor oil sump feed from oil reservoir
- Valve B: allows oil return from suction accumulator
Test rig execution allows reliable performance tests on large size CO2 transcritical compressors. The compressor discharge flows into an oil separator where the oil is very efficiently separated from the CO2 stream. Lubricant is recovered into a lower pressure reservoir, from which oil fills the compressor sump when valve A opens. After the oil separator high pressure CO2 flows into the gas cooler, it is then expanded by a high-pressure valve to feed the evaporator. A suction accumulator is further separating CO2 exiting the evaporator from the residual lubricant content, with oil being returned from its bottom toward the compressor suction line via valve B.
Both valve A and valve B can either be manually operated or can be working with a dedicated opening control logic depending on the oil level detected in the compressor sump.
The test rig is connected to automated acquisition data equipment for proper operating parameters recording.
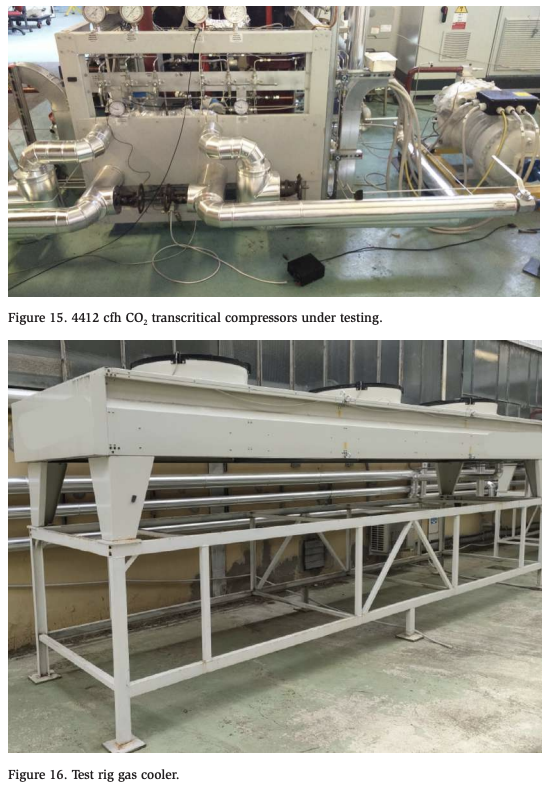
Figure 15 and 16 show some test equipment details.
Test Procedures and Results
Given the previously mentioned compressor designs, design A and design B have been investigated regarding reliability and performance, while design C and design D have been investigated regarding oil circulation rate. All compressor configurations have been tested with 460V – 3ph – 60Hz electric motor supply.
Reliability and Performance
Internal reliability and performance tests are typically performed to validate a certain compressor design. Therefore, a number of operating conditions have been considered, reflecting compressors’ real life operation in refrigeration systems and possibly going beyond the standard compressor application envelope in order to keep an appropriate safety margin against possible misuse.
Figure 17 shows a typical CO2 transcritical compressor application envelope [11], three test operating conditions are also reported.
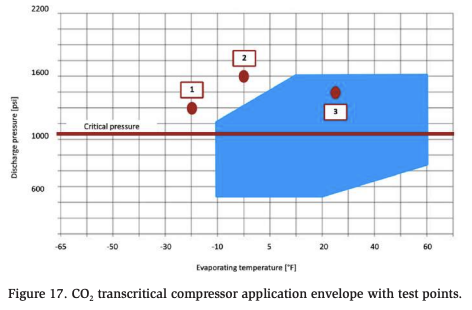
The three test operating points fall out from the normal compressor envelope as follows:
#1: 200 psi suction pressure, 1200 psi discharge pressure, 18°F superheat: Maximum pressure ratio Challenge: maximum discharge temperature
#2: 285 psi suction pressure, 1500 psi discharge pressure, 18°F superheat.: Maximum pressure difference Challenge: maximum stress on the drive gear
#3: 435 psi suction pressure, 1300 psi discharge pressure, 18°F superheat: Typical real life field operation for an MT compressor
For each of these three test operating points, specific tests have been performed including continuous operation for 2,000 hours and 200,000 short cycles, with 5s operation and 10s standstill, being defined as Accelerated Lifetime Testing (ALTT). The various compressor designs’ performances have been recorded first, so that eventual differences in the wear rate could not have an influence on the mass flows and power consumption readings. Table 6 shows test results.
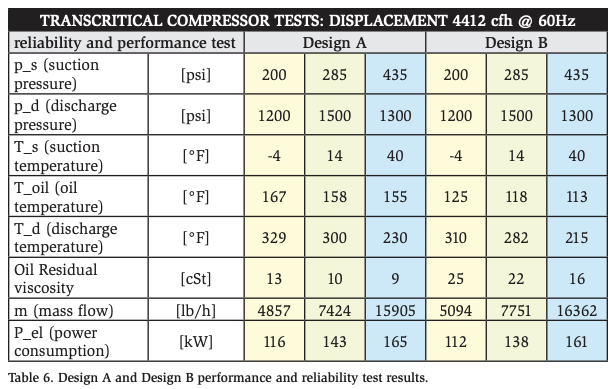
These test results correspond to the readings performed before the ALTT start, in order to understand how Design A and Design B perform without any influence of eventually different wear rate evolution; several differences can be noted between the designs, as follows.
Oil temperature: Oil temperature significantly differs between the two designs. Use of an external discharge manifold has a positive effect on Design B’s oil temperature, decreasing lubricant thermal level in a range of 40°F to 42°F.
Discharge temperature: Discharge temperature differences are less relevant, but still in place, this being a symptom that, above all, design B is able to assure a better compressor heat dissipation toward the surrounding ambient and allowing for safer compressor operation.
Oil residual viscosity: Oil residual viscosity is severely impacted by the aforementioned differences between Design A and Design B’s oil temperatures; larger differences are in place for test point #1 and test point #2 that are far from the officially released application envelope. However, test point #3 falls well into the compressor envelope and also in this case a serious residual viscosity difference is noticeable.
Mass flow and power consumption: Mass flow and power consumption represent the real compressor performance. Design B overperforms Design A at all the 3 test points, though differences are more relevant for test points #1 and #2, this being explainable with the higher pressure ratios involved. Higher pressure ratios induce higher discharge temperatures, which then amplify the difference in compressors’ volumetric and isentropic efficiencies.
After design A and design B compressors’ performance have been recorded, the two designs have been subject to accelerated lifetime testing, consisting in using test points #1, #2 and #3 for the following experiments:
- Continuous run for 2000 hours for each of the test points
- 200.000 short cycles (5s run, 10s stop) for each of the test points
After accelerated lifetime tests completion, Design A and Design B compressors have been disassembled to check internal parts’ appearance and wear rate. A significant difference in the parts’ wear rate was detected, including but not limited to the wrist pin, as shown in Figure 18.
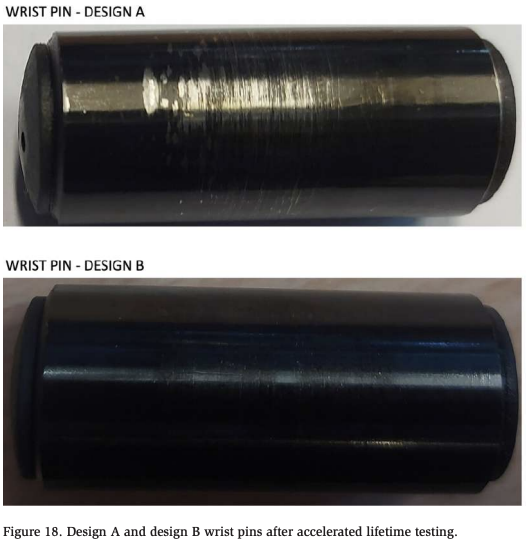
This internal analysis confirms that the wrist pin is one of the more vulnerable components in a CO2 compressor. However, accelerated lifetime testing has confirmed that faster wrist pin wear rates can be managed with the use of Design B compressors, enabling lower oil temperatures, higher residual viscosity, and therefore more reliable compressor operation.
Oil Circulation Rate
Oil circulation rate measurements are normally very complicated to carry out: in fact, many operating parameters have a strong influence on the oil quantity, which is determined by the suction gas stream, including but not limited to suction pressure, suction superheat and oil level into the sump. In order to characterize the OCR for Designs C and D, compressors have been tested in a typical medium temperature operating condition, as follows:
p_suc = 580 psi // p_d = 1300 psi // T_suc = 40°F
Designs C and D are both tested on the same test bench, they are both equipped with the same design oil pump, a same design oil differential pressure switch (ODPS) and same oil charge (V_oil = 1.05 gal). Both designs will be tested at #3 operating conditions, e.g., 435 psi suction pressure, 1300 psi discharge pressure, and 18°F superheat.
Prior starting Design C and Design D compressor tests, the test rig has been vacuumed and no additional oil was filled, neither into the compressors nor into the oil reservoir. Compressors have then been put in operation exclusively with their original oil charge, and valves A & B (see Figure 14) were kept continuously closed so as to avoid any sort of oil return from the system to the compressors’ sump. In doing so, oil levels monitored at the compressors’ sight glass have been progressively going down, being at a certain point no longer visible through the same sight glass. However, safe compressor operation was still assured by a sufficient oil pump pressure, this also being an additional parameter being continuously monitored.
Both Designs C and D are equipped with the same oil pump and the same oil differential pressure switch (triggering at 14.5 psi, 1.0 bar differential pressure). Figure 7 shows how oil flow is developed, with the pump sucking the lubricant through an oil filter, being placed at the very bottom of the compressor sump.
Therefore, since no oil return from the system to the compressor is in place, when the oil differential pressure alarm is triggered, it is very reasonable to assume that no more lubricant is present in the compressor sump: if no oil level is in place in the sump, the oil pump will not be able to generate any differential pressure.
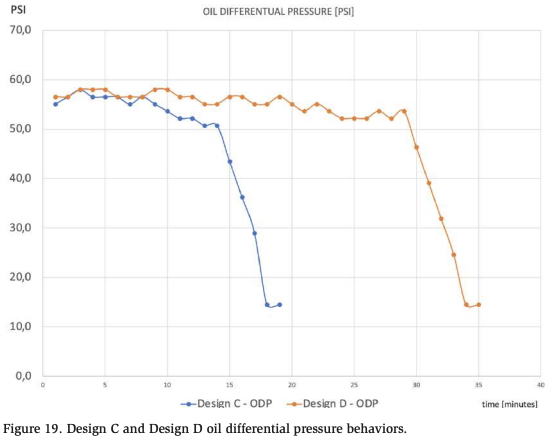
Figure 19 shows the oil differential pressure behavior in time for Design C and Design D compressors: it is clearly understandable how Design D features a much lower oil circulation rate, this being possible thanks to the new internal gas stream design bypassing the main oil throw area. In fact, Design C is able to keep a stable and safe oil pressure only for 13 minutes, then experiencing a severe and quick oil pressure drop, with oil differential pressure switch triggering at minute n. 17. On the other hand, Design D is able to maintain a very stable oil pressure for much longer; its oil pressure starts to drop at minute n.29 with oil differential pressure switch triggering at minute n.34.
Conclusions
This work has described some of the main technical challenges that are to be faced when designing a CO2 transcritical compressor for larger industrial applications, with displacements up to 4412 cfh and motor powers up to 160 hp. Specific engineering solutions have been developed, described, and tested.
From a reliability and performance perspective, test results have confirmed that the use of an external discharge manifold (Design B), similar to what is currently used in combustion engine design, has strongly mitigated internal heat dissipation toward the lubricant, thus leading to safer compressor operation thanks to lower oil temperature, higher residual viscosity, lower discharge temperature and higher performance levels.
However, large industrial applications typically feature very long pipe runs, calling for an accurate and adequate oil management. Therefore, in addition to reliability and performance, the compressor oil circulation rate is a key challenge to be addressed. Thanks to a specific internal gas stream (Design D), it has been possible to consistently decrease the oil circulation rate.
References
[1] Pisano, G., 2020, “Trans-critical carbon dioxide and ammonia: energy efficiency and basic capital cost comparison for industrial refrigeration systems.” IIAR Orlando Virtual Conference. [2] Danfoss ruler software for refrigerants properties, November 2021, https://www. danfoss.com/it-it/service-and-support/downloads/dcs/ref-tools/. [3] Pachai, A. C. et Al, 2010, “CO2 – Yesterday’s Buzzword – Today’s Real Refrigerant.” [4] Lenz, J. R., 2002, “Polytropic Exponents for Common Refrigerants.” International Compressor Engineering Conference, Purdue. [5] Mukherjee, N., 2020, “Role of polytropic index n = Cp / Cv in compression of gases.” November 2021, https://www.linkedin.com/pulse/role-polytropic-indexn-cpcv-compression-gases-nikhilesh-mukherjee/. [6] Reniso Refrigeration Oils literature, November 2021, https://www.fuchs.com/ fileadmin/schmierstoffe/Prospekte/Brochures_EN/Product_brochures_industry/ Refrigeration-Oils.pdf [7] Pisano, G., 2020 “Trans-critical carbon dioxide and ammonia: energy efficiency and basic capital cost comparison for industrial refrigeration systems.” IIAR Orlando virtual conference. [8] Rowe R., “Gasoline engine exhaust manifold temperatures.” November 2021, https://itstillruns.com/octane-booster-4779644.html. [9] Jackson, S., 2019, “Factors driving change for industrial refrigeration systems,” November 2021, https://www.process-cooling.com/articles/89701-factors-drivingchange-for-industrial-refrigeration-systems. [10] Danfoss Literature, “Industrial Refrigeration, Ammonia and CO2 applications,” November 2021, http://www.cold.org.gr/library/downloads/Docs/Industrial%20 refrigeration%20Ammonia%20&%20CO2%20applications%20_handbook%20 Part%20I.pdf. [11] Dorin literature, “CD range for CO2 transcritical applications.” November 2021, https://www.dorin.com/documents/Download/18/1LTZ016_CD_10.2021.pdf.Acknowledgements
The author wishes to thank OFFICINE MARIO DORIN S.p.A. for their permission to publish this paper. Special thanks to ER&D: Lorenzo Bulgarelli, Mauro Dallai, and Lorenzo Fanetti.